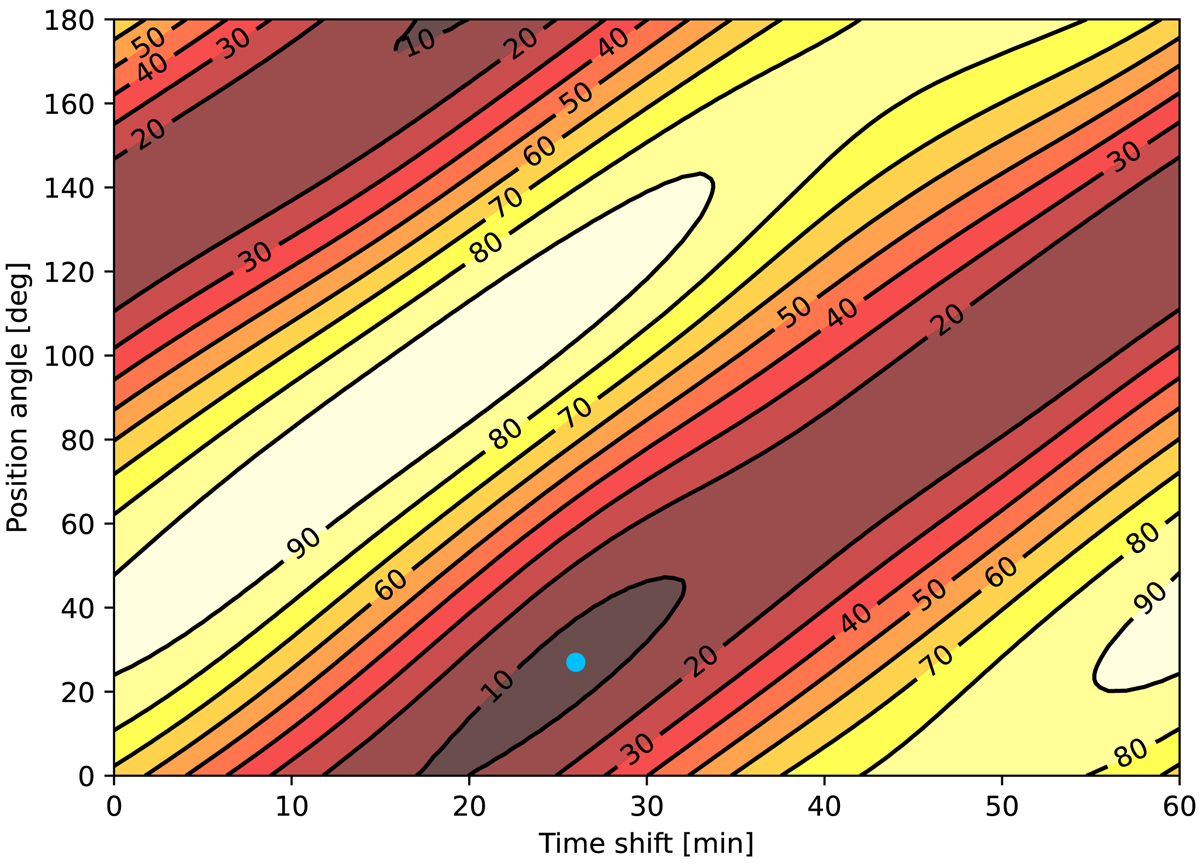
Fig. C.2.
Download original image
χ2 contour map for the polarization model as a function of position angle and time shift for a fixed radius of 9Rg. The blue dot represents the minimum at (27 min, 25°). A slight degeneracy between the two variables exists since, for each position angle, there is a corresponding optimum time shift that adjusts the model to start at the right time. The corresponding model is displayed in Fig. 5.
Current usage metrics show cumulative count of Article Views (full-text article views including HTML views, PDF and ePub downloads, according to the available data) and Abstracts Views on Vision4Press platform.
Data correspond to usage on the plateform after 2015. The current usage metrics is available 48-96 hours after online publication and is updated daily on week days.
Initial download of the metrics may take a while.