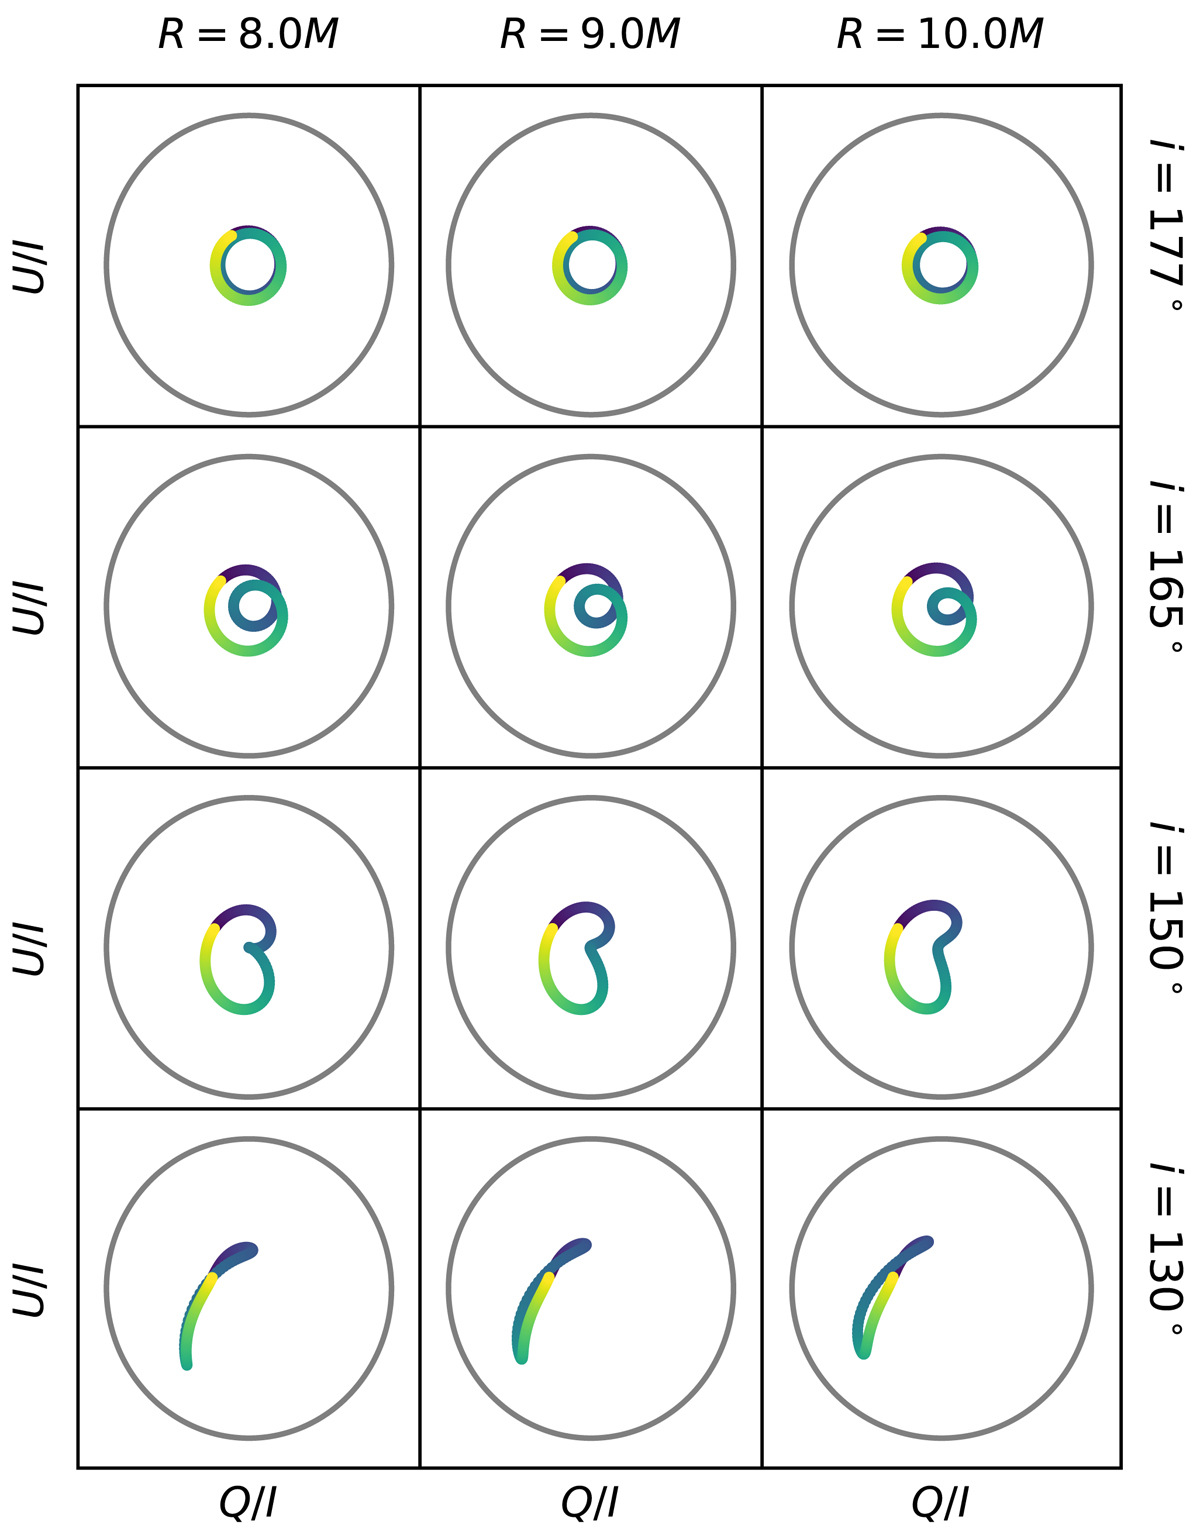
Fig. C.1.
Download original image
Illustration of Q-U loops for different radii and inclinations for the case of a poloidal field geometry. The color-coding indicates time, as in Fig. 3. A single loop occurs for a narrow range of almost face-on inclinations. The gray circle represents unitary fractional polarization, and the average depolarized emission is ⟨Inp⟩ = 0.3 for all plots.
Current usage metrics show cumulative count of Article Views (full-text article views including HTML views, PDF and ePub downloads, according to the available data) and Abstracts Views on Vision4Press platform.
Data correspond to usage on the plateform after 2015. The current usage metrics is available 48-96 hours after online publication and is updated daily on week days.
Initial download of the metrics may take a while.