Fig. A.1.
Download original image
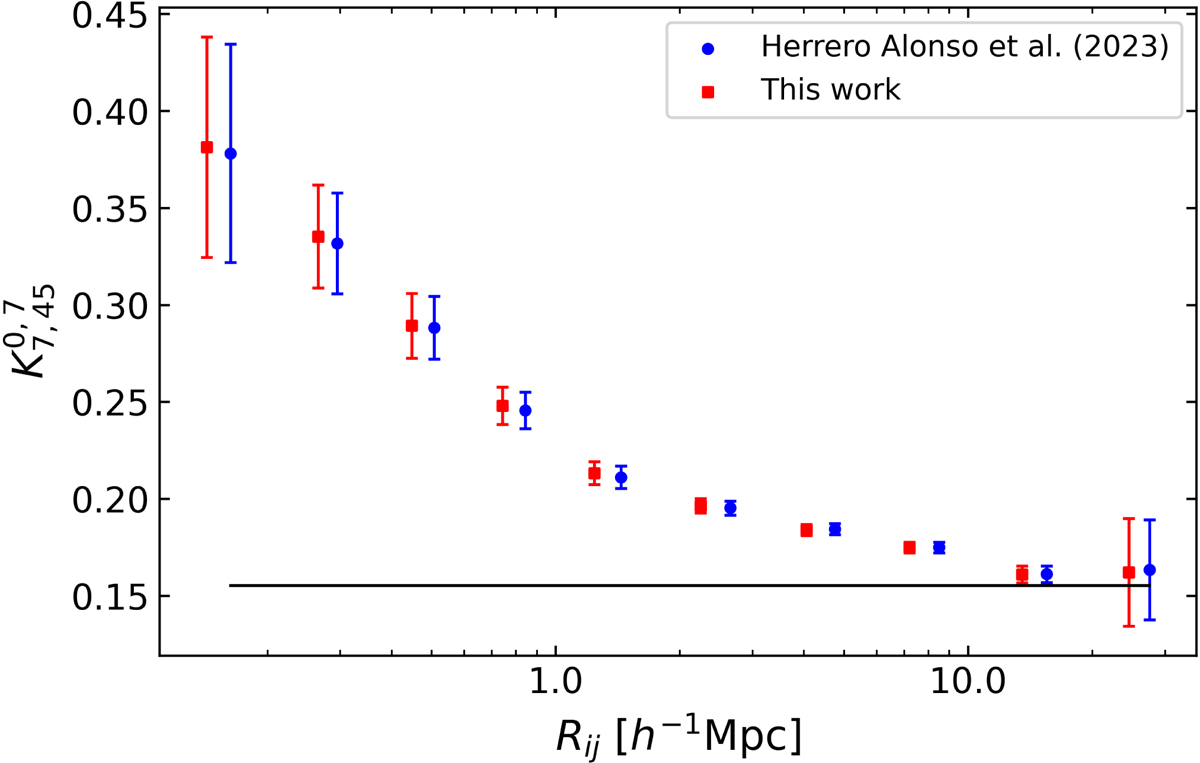
Clustering strength as measured by the K-estimator (Adelberger et al. 2005) for the LAE dataset considered in HA23 at 3 < z < 6 (blue) and that of the LAE sample at 3 < z < 5 used in this work (red). The black baseline represents the expected value for an unclustered sample. The error bars are Poissonian. The red measurements have been shifted along the x-axis for visual purposes.
Current usage metrics show cumulative count of Article Views (full-text article views including HTML views, PDF and ePub downloads, according to the available data) and Abstracts Views on Vision4Press platform.
Data correspond to usage on the plateform after 2015. The current usage metrics is available 48-96 hours after online publication and is updated daily on week days.
Initial download of the metrics may take a while.