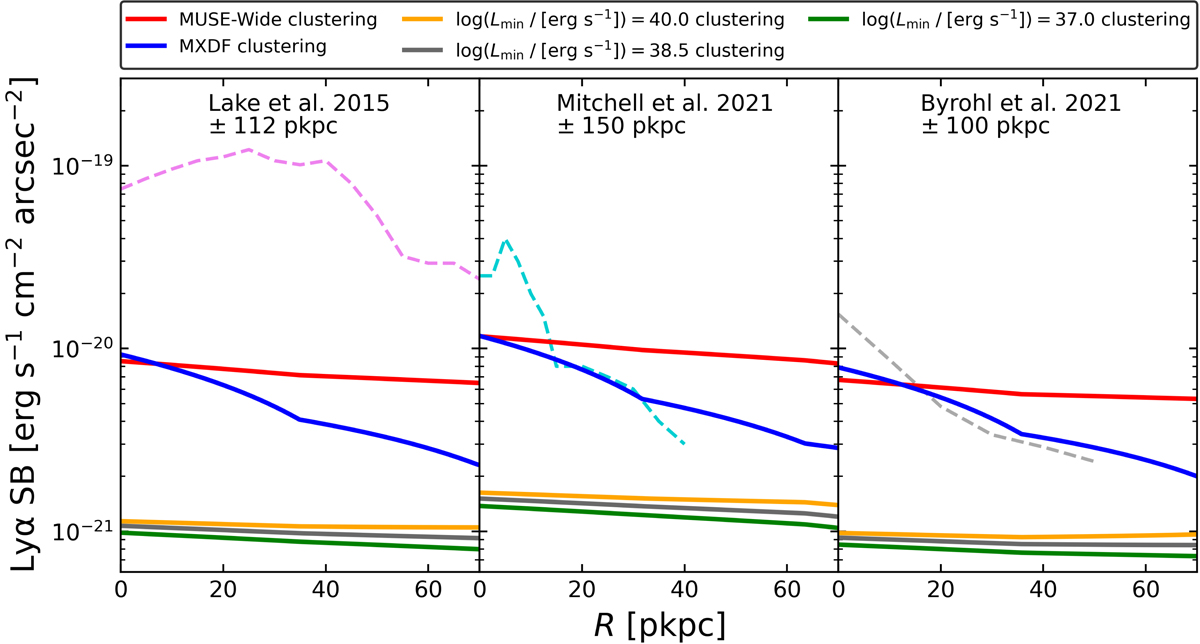
Fig. 8.
Download original image
Comparison of our Lyα SB profiles from undetected LAEs of log(Lmin/[erg s−1]) = 38.5 (solid lines) and the satellite radial profiles predicted from simulations (dashed lines). The different colors of the solid curves correspond to the different clustering assumptions for the undetected LAEs displayed in the legend. Resolved LAEs are assumed to cluster in the same way as those in the MUSE-Wide sample. We adjusted our pseudo-NB width of Eq. (4) to the projection depth of the simulations. Left panel: comparison to L15, whose applied projection depth is equivalent to a pseudo-NB width of 66 km s−1 at zsimul = 3.1. Middle panel: comparison to M21 with a pseudo-NB width of 94 km s−1 at zsimul = 3.5. Right panel: comparison to B21 with a pseudo-NB width of 56 km s−1 at zsimul = 3.
Current usage metrics show cumulative count of Article Views (full-text article views including HTML views, PDF and ePub downloads, according to the available data) and Abstracts Views on Vision4Press platform.
Data correspond to usage on the plateform after 2015. The current usage metrics is available 48-96 hours after online publication and is updated daily on week days.
Initial download of the metrics may take a while.