Open Access
Fig. 1.
Download original image
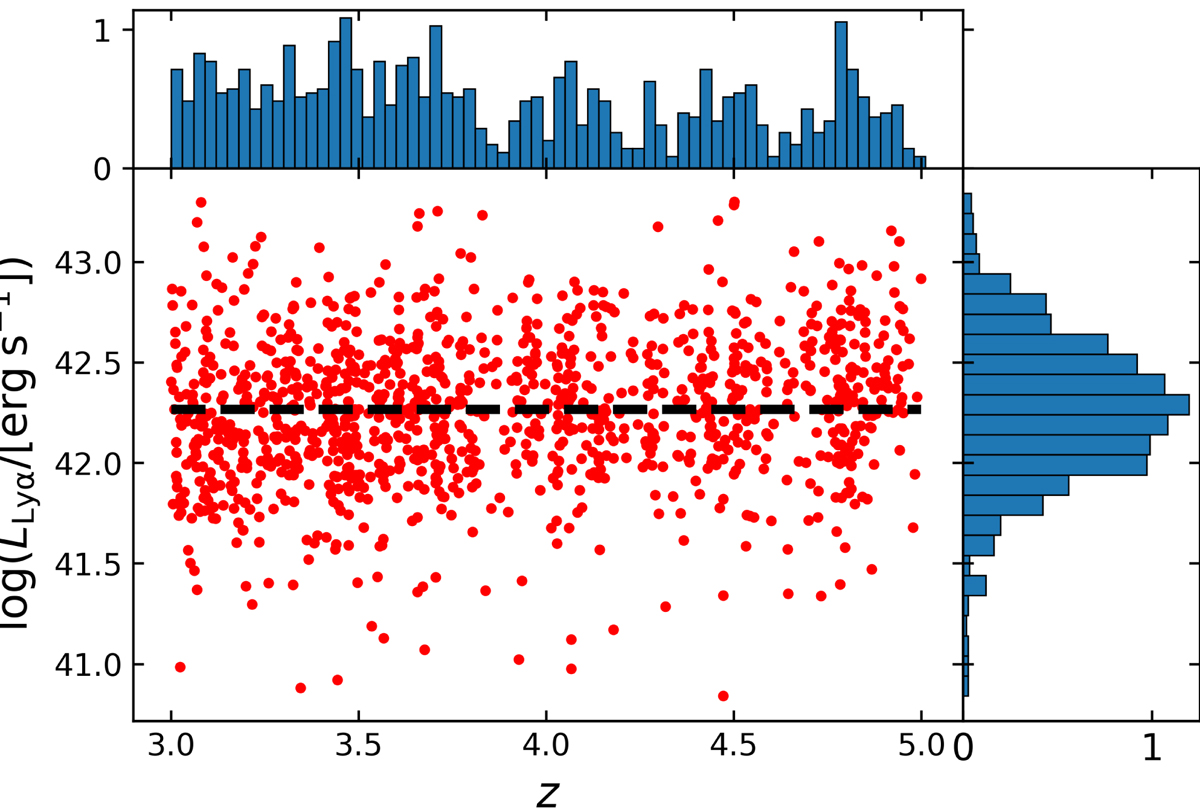
Distribution in Lyα luminosity-redshift space of the 3 < z < 5 LAEs selected from the spectroscopic MUSE-Wide survey. The dashed line corresponds to the median log LLyα of the sample. The normalized redshift and log LLyα distributions are shown in the top and right panels, respectively.
Current usage metrics show cumulative count of Article Views (full-text article views including HTML views, PDF and ePub downloads, according to the available data) and Abstracts Views on Vision4Press platform.
Data correspond to usage on the plateform after 2015. The current usage metrics is available 48-96 hours after online publication and is updated daily on week days.
Initial download of the metrics may take a while.