Fig. 5.
Download original image
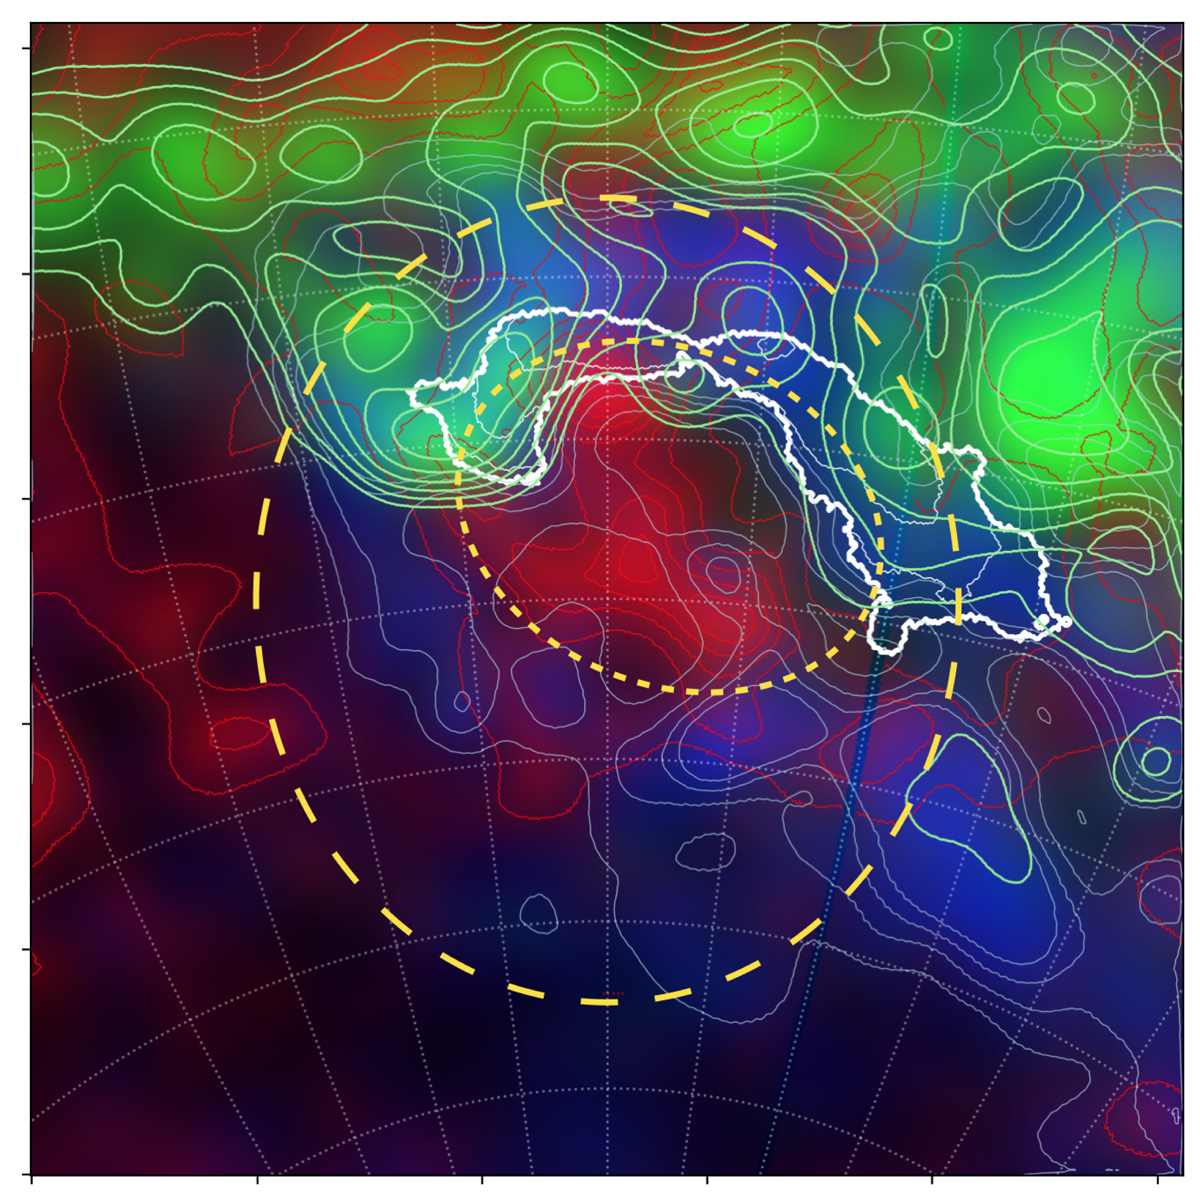
RGB composite image showing: the 3D dust map integrated between 300 and 500 pc in blue colours and contours as in Fig. 2. The 26Al emission map from Diehl (2002) is shown in red colours and contours. Red contours are between 2.8 × 10⁻⁶ and 2.4 × 10⁻⁴ cm−2 sr−1 s−1 in steps of 2.7 × 10⁻⁵ cm−2 sr−1 s−1. The Orion-Taurus ridge is shown with white contours as in Fig. 1; the NH2 map from Kalberla et al. (2020) is in green colours and contours between 6.3 × 10²⁰ and 1022 cm−2 in log10-steps of 0.2. The yellow circles are the same as in Fig. 2.
Current usage metrics show cumulative count of Article Views (full-text article views including HTML views, PDF and ePub downloads, according to the available data) and Abstracts Views on Vision4Press platform.
Data correspond to usage on the plateform after 2015. The current usage metrics is available 48-96 hours after online publication and is updated daily on week days.
Initial download of the metrics may take a while.