Fig. 3.
Download original image
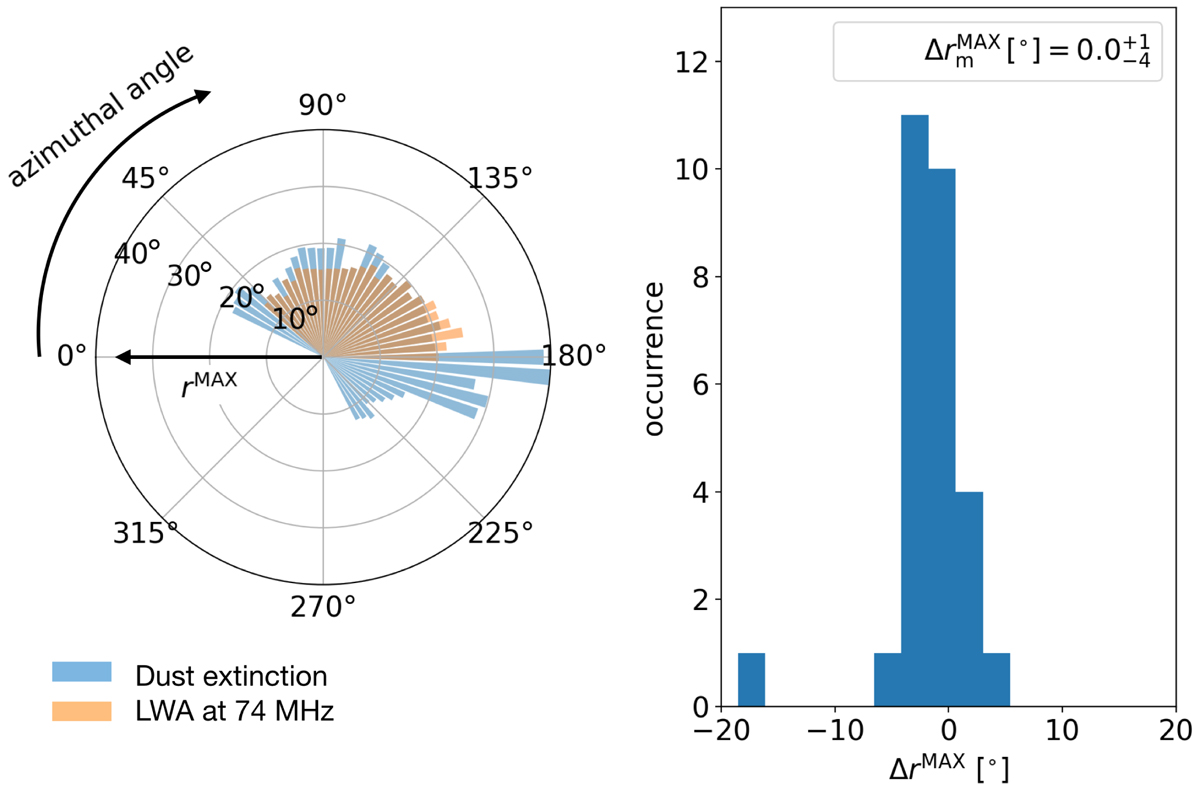
Morphological correlation between the Orion-Taurus ridge and the 3D dust map. Left panel: polar plot of rMAX as a function of the azimuthal angle in bins of 5° (increasing in the E-W direction); also, rMAX is computed for Tb(74 MHz) (orange) and the 3D dust map integrated between 300 and 500 pc (blue). Right panel: histogram of the difference between the rMAX distributions shown on the left. The reported values correspond to the median and the corresponding errors (16th and 84th percentiles).
Current usage metrics show cumulative count of Article Views (full-text article views including HTML views, PDF and ePub downloads, according to the available data) and Abstracts Views on Vision4Press platform.
Data correspond to usage on the plateform after 2015. The current usage metrics is available 48-96 hours after online publication and is updated daily on week days.
Initial download of the metrics may take a while.