Open Access
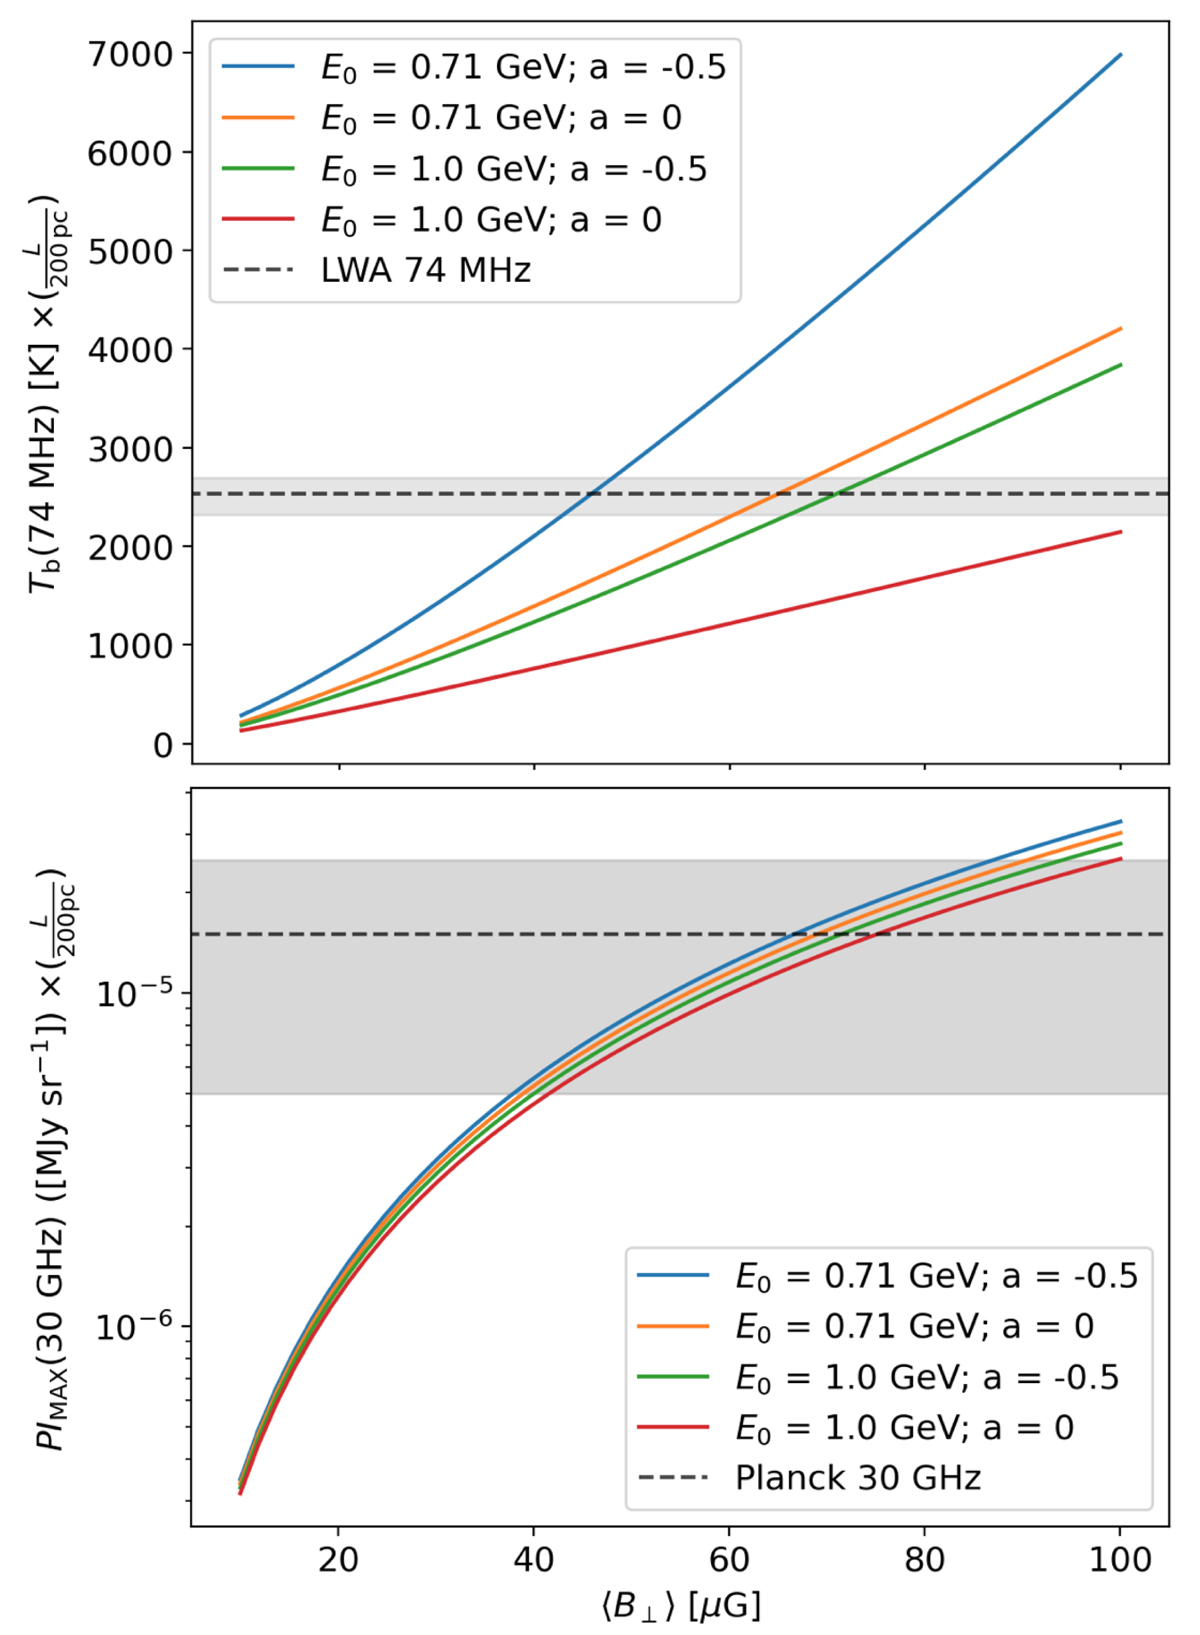
Fig. B.3.
Download original image
Estimates of Tb(74 MHz) – top – and PIMAX(30 GHz) – bottom – of the Orion-Taurus ridge from models of Padovani et al. (2018, 2021). The quantities are derived as a function of ⟨B⊥⟩, a, and E0. The horizontal black dashed lines, with grey errors, represent the corresponding median values reported in Sect. 4.
Current usage metrics show cumulative count of Article Views (full-text article views including HTML views, PDF and ePub downloads, according to the available data) and Abstracts Views on Vision4Press platform.
Data correspond to usage on the plateform after 2015. The current usage metrics is available 48-96 hours after online publication and is updated daily on week days.
Initial download of the metrics may take a while.