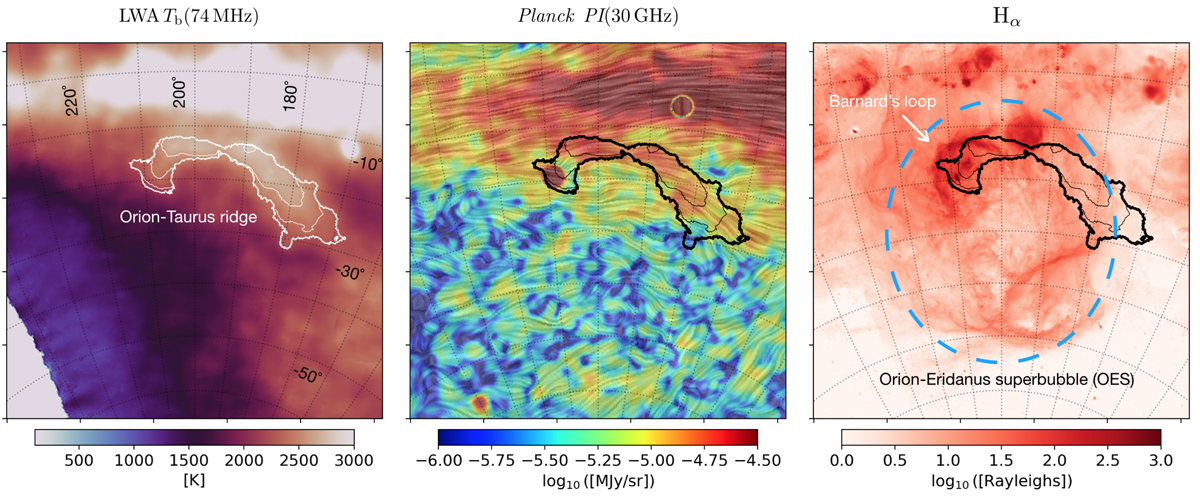
Fig. 1.
Download original image
Stereographic projections showing the Orion-Taurus ridge. Left: brightness temperature (Tb) at 74 MHz observed by the LWA telescope at 2° FWHM resolution. The contours are at 2100, 2200, 2400, 2600, and 2800 K, respectively. Center: polarized intensity (PI) at 30 GHz observed by the Planck satellite at the same FWHM resolution of Tb(74 MHz) with the plane-of-the-sky magnetic field orientation traced by line integral convolution (Cabral & Leedom 1993). Black contours are the same as in the left panel. Right: Hα emission map from Finkbeiner (2003) showing the Orion-Taurus ridge in contours and the extent of the Orion-Eridanus superbubble (OES) traced in blue as in Soler et al. (2018). The same Galactic coordinate grid is shown in all panels with steps in l and b of 10° and centered in (l, b) = (200° , − 30°). The stereographic projection was produced with the Python routine stereo_proj_hpx that can be found http://github.com/abracco/cosmicodes/blob/master/4GMIMS/Planckroutines.py.
Current usage metrics show cumulative count of Article Views (full-text article views including HTML views, PDF and ePub downloads, according to the available data) and Abstracts Views on Vision4Press platform.
Data correspond to usage on the plateform after 2015. The current usage metrics is available 48-96 hours after online publication and is updated daily on week days.
Initial download of the metrics may take a while.