Fig. 3
Download original image
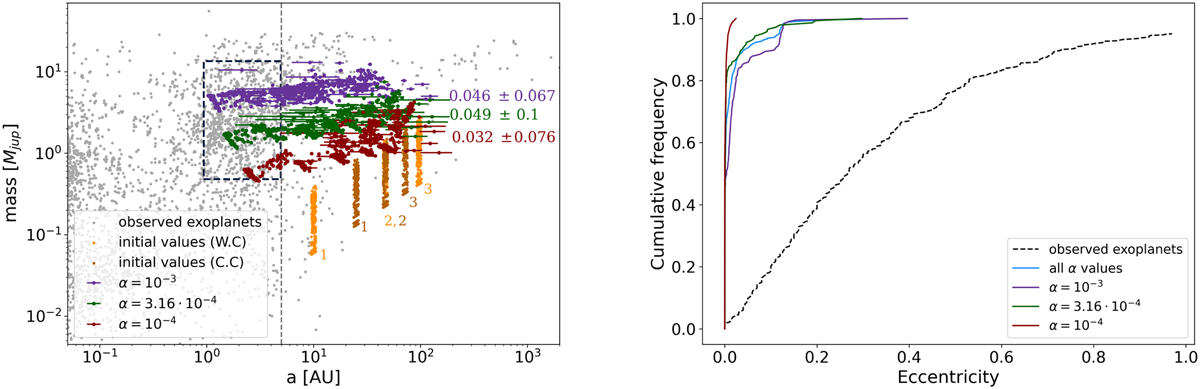
Left panel: comparison between the observed giant exoplanet population (grey dots) and all the simulations for the three-planet systems. The initial values of these planets are denoted as orange for the case where the planets located in a wide configuration while brown dots denote planets located in a compact configuration, where the small numbers indicate the position of the first, second, and third planet. Purple, green, and red data points symbolise the simulations for the different α, 10−3, 3.16 × 10⁻⁴, and 10−4, respectively, whereas the coloured numbers shows the mean value and the standard deviation of the eccentricity for each case for all the simulated three- planet systems. The horizontal lines refers to the perihelion and aphelion of the planet a(1 ± e). The vertical black dashed line represents the current RV detection limit at 5 AU. Right panel: cumulative frequency of the eccentricity for planets up to 5 AU and mass between 0.5 ≤ mass(MJup) ≤ 13. We also note that these plots include both cases for the initial mass (fixed and random value).
Current usage metrics show cumulative count of Article Views (full-text article views including HTML views, PDF and ePub downloads, according to the available data) and Abstracts Views on Vision4Press platform.
Data correspond to usage on the plateform after 2015. The current usage metrics is available 48-96 hours after online publication and is updated daily on week days.
Initial download of the metrics may take a while.