| Issue |
A&A
Volume 677, September 2023
|
|
|---|---|---|
| Article Number | A128 | |
| Number of page(s) | 5 | |
| Section | Interstellar and circumstellar matter | |
| DOI | https://doi.org/10.1051/0004-6361/202347199 | |
| Published online | 19 September 2023 | |
Electronic spectroscopy of 1-cyanonaphthalene cation for astrochemical consideration
1
School of Chemistry, University of Edinburgh, Joseph Black Building, Kings Buildings,
David Brewster Road,
Edinburgh
EH9 3FJ, UK
e-mail: This email address is being protected from spambots. You need JavaScript enabled to view it.
2
Université Paris-Saclay, CNRS, Institut des Sciences Moléculaires d’Orsay,
91405
Orsay, France
e-mail: This email address is being protected from spambots. You need JavaScript enabled to view it.
Received:
15
June
2023
Accepted:
14
August
2023
Abstract
Context. Polycyclic aromatic hydrocarbons (PAHs) are believed to be the carriers of the aromatic infrared bands and have been proposed as candidates to explain other astronomical phenomena such as diffuse interstellar bands (DIBs). The first aromatic structures possessing more than one ring, 1- and 2-cyanonaphthalene (CNN), were recently detected by rotational spectroscopy in the dense molecular cloud TMC-1. Laboratory investigations have indicated that due to fast and efficient relaxation through recurrent fluorescence (RF), CNN+ may be photostable in the harsh conditions of the lower density, more diffuse regions of the interstellar medium (ISM) exposed to ultraviolet (UV) radiation. As a result, it has been suggested that the widely held belief that small PAHs present in these regions are dissociated may need to be revisited. If 1-CNN+ is able to survive in the diffuse ISM it may contribute to the population of 1-CNN observed in TMC-1. To investigate the abundance of 1-CNN+ in diffuse clouds, laboratory spectroscopy is required. The present work concerns the electronic spectroscopy of 1-CNN+ in absorption and the search for its spectroscopic fingerprints in diffuse clouds.
Aims. The aim is to obtain laboratory data on the electronic transitions of gas-phase 1-CNN+ under conditions appropriate for comparison with DIBs and assess abundance in diffuse clouds.
Methods. Spectroscopic experiments are carried out using a cryogenic ion trapping apparatus in which gas-phase 1-CNN+ is cooled to temperatures below 10 K through buffer gas cooling. Calculations are carried out using time-dependent density-functional theory.
Results. Experimental and theoretical data on the D2 ← D0 and D3 ← D0 electronic transitions of 1-CNN+ are reported. The former transition has a calculated oscillator strength of f = 0.075 and possesses a pattern dominated by its origin band. The origin band is located at 7343 Å and has a full width at half maximum of 28 Å. In observational data, this falls in a region polluted by telluric water lines, hindering assessment of its abundance.
Conclusions. Space-based observations are required to search for the spectroscopic signatures of 1-CNN+ and evaluate the hypothesis that this small aromatic system, stabilised by RF, may be able to survive in regions of the ISM exposed to UV photons.
Key words: ISM: molecules / techniques: spectroscopic
These authors contributed equally to this work.
© The Authors 2023
 Open Access article, published by EDP Sciences, under the terms of the Creative Commons Attribution License (https://creativecommons.org/licenses/by/4.0), which permits unrestricted use, distribution, and reproduction in any medium, provided the original work is properly cited.
This article is published in open access under the Subscribe to Open model. This email address is being protected from spambots. You need JavaScript enabled to view it. to support open access publication.
1 Introduction
Polycyclic aromatic hydrocarbons (PAHs) have long been hypothesised to be present in the interstellar medium (ISM; see, for example, Tielens (2008) and references therein). They are proposed as carriers of the aromatic infrared bands (AIB), a set of mid-infrared (IR) emission features detected at wavelengths that correspond to the normal modes of CH-bending and CC-,CH-stretching of aromatic molecules (Duley & Williams 1981; Léger & Puget 1984). AIBs originate from the IR radiative cooling of molecules following ultraviolet (UV) photon absorption (Sellgren 1984).
The observed mid-IR emission bands are a collective signal produced by a large set of molecules. A consequence of this is that differences between emission from similar PAH structures are unresolved in this wavelength region (Tielens 2008). The majority of molecules detected in the ISM are identified based on their rotational spectra (McGuire 2018). Recently, individual members of this aromatic molecular family have been observed using this method. Two nitril-group functionalised PAHs, 1- and 2-cyanonaphthalene (C10H7CN, here written CNN), are detected in the molecular cloud TMC-1 using spectral matched filtering (McGuire et al. 2021) based on their laboratory rotational spectra (McNaughton et al. 2018).
The abundance of CNN isomers reported in TMC-1 is higher than predicted by astrochemical models (McGuire et al. 2021). Formation mechanisms of PAHs in the ISM are under debate, and contemporary laboratory studies are investigating both top-down and bottom-up routes (Tielens 2008; Zhao et al. 2018; Reizer et al. 2022). Due to their ability to survive destructive processes in regions of the ISM exposed to UV photons, the astrophysically relevant size for PAHs has been reported to be in the order of 40–50 C atoms (Sellgren 1984; Allamandola et al. 1989). Smaller PAHs are thought to be destroyed due to their inability to radiatively stabilise via emission of IR photons (Chabot et al. 2019). Experiments on cations such as naphthalene have shown that the molecular framework is completely destroyed upon irradiation with a Xe arc lamp resembling a 6200 K blackbody (Ekern et al. 1998). However, a recent laboratory study reports that CNN+ can be stabilised rapidly through recurrent fluorescence (RF; Stockett et al. 2023). In this process, radiative cooling occurs through emission of optical photons from electronically excited states that are populated spontaneously via inverse internal conversion (Léger et al. 1988; Nitzan & Jortner 1979). Consequently, RF is a fast process that can rapidly release a large amount of energy, preventing CNN+ dissociation and thus allowing CNN+ to survive UV photon absorption in the ISM (Stockett et al. 2023).
The optical and near IR spectra of stars viewed through diffuse regions of the ISM contain absorption features collectively known as the diffuse interstellar bands (DIBs). Many possible carrier molecules have been proposed to be responsible for some of the more than 600 DIBs observed to-date (see, for example, Campbell & Maier 2017a and references therein). However, only  has been identified as a DIB carrier (Campbell et al. 2015; Walker et al. 2015). Among other carbonaceous species, PAHs are also suggested as DIB candidates (Léger & d’Hendecourt 1985; Van der Zwet & Allamandola 1985; Duley 2006), motivating laboratory studies of their electronic spectroscopy.
The electronic absorptions of several neutral and charged PAHs have been measured in rare gas matrices as well as in the gas-phase (for example Pino et al. 1999; Bréchignac & Pino 1999; Bréchignac et al. 2001; Biennier et al. 2003, 2004; Halasinski et al. 2003; Malloci et al. 2004; Sukhorukov et al. 2004; Mattioda et al. 2005; Kokkin et al. 2008; Dryza et al. 2012; Patzer et al. 2013; Roithová et al. 2019). Extensive theoretical work on the spectroscopy of PAHs has also been reported (see, for example, Malloci et al. 2004). Surveys comparing existing experimental spectra with astronomical data were published in 2011, see Salama et al. (2011), Gredel et al. (2011), and references therein. Obtaining gas-phase spectra of large cationic molecules under conditions such that they are useful for comparison with astronomical observations is challenging (Pino et al. 2013; Salama & Ehrenfreund 2013). However, due to advances in laboratory methods, experimental measurement of the gas-phase electronic spectra of PAH cations containing up to 42 carbon atoms using action spectroscopy techniques are reported (Zhen et al. 2016; Hardy et al. 2017; Campbell & Maier 2017b). None of the detected laboratory absorptions are associated with DIBs, and the same conclusion applies to several protonated PAHs (Hardy et al. 2013; Patzer et al. 2013; Rice et al. 2014; Noble et al. 2015).
In this contribution, low temperature gas-phase electronic spectra of 1-CNN+ are reported. These data were obtained following buffer gas cooling in a cryogenic ion trapping apparatus. Section 2.1 describes the experimental methods, and computational procedures are outlined in Sect. 2.2. The experimental data and its comparison with theory is presented in Sect. 3. Finally, the astrochemical implications are given in Sect. 4, and conclusions in Sect. 5.
2 Methods
2.1 Expérimental
Experiments on 1-CNN+ were carried out with a cryogenic ion trap apparatus described previously (Campbell et al. 2016), and only details relevant to the present work are given here. Singly charged CNN cations were generated via 40 eV electron impact ionisation of the neutral gas produced from a sample of 1-CNN obtained from Alfa Aesar (95%). A typical mass spectrum recorded by operating the first quadrupole mass spectrometer in transmission mode and scanning the second is shown in Fig. 1.
This is dominated by a peak at m/z 153, due to 12Cn1H714N+, with fragment ions appearing below m/z 130 at lower abundance.
Spectroscopic measurements were realised after loading mass-selected ions with m/z 153 into the trap and cooling through collisions with cryogenic (Tnom = 4K) helium buffer gas, present at number densities of some 1015 cm−3. Under these conditions a proportion of the primary 1-CNN+ ions formed weakly bound complexes with helium atoms, as illustrated in Fig. 1. This enabled spectroscopic observation of electronic transitions by monitoring the depletion of 1-CNN+ – He (m/z 157) following exposure to resonant laser excitation. To record these data, the helium buffer gas was pumped out of the trap for several hundred milliseconds before the ion cloud was irradiated with pulsed, tuneable radiation from either an OPO/OPA (Ekspla, linewidth ~5 cm−1) or Nd:YAG pumped Dye Laser (Sirah, linewidth ~0.05 cm−1). The trapping sequence was repeated at a rate of 1 Hz. Through the use of a mechanical shutter, data were monitored on alternate cycles with (Ni) and without (N0) exposure to radiation to account for fluctuations in the number of stored ions. The resulting attenuation (1 − Ni/N0) was corrected for the number of background ions (NB) appearing at m/z 157 that did not dissociate following exposure to >10 pulses of radiation on resonance with their electronic absorption at high power (several mJ/pulse) using (1 − (Ni − NB)/(N0 − NB)). Spectra were recorded at significantly reduced laser fluence and corrected for changes to laser power with wavelength. Due to experimental difficulties associated with accurate determination of absolute laser fluence seen by the ions, spectra were plotted in terms of the relative fragmentation cross-sections, σrel.
Two-colour experiments were carried out by monitoring the fragmentation of untagged 1-CNN+ ions. This was achieved by observation of the appearance of fragment ions with m/z 126, corresponding to the loss of HCN and/or HNC. No other fragment ions were observed upon two-colour dissociation of 1-CNN+. Data were recorded at elevated trap temperatures, Tnom ≥ 8 K, to remove helium complexes from the stored ensemble. The number of ions with m/z 126 were recorded on alternate trapping cycles with and without exposure to laser radiation. A dye laser was used to scan over the wavelength range of interest and a fixed frequency OPO (λ = 4800 Å) was used to dissociate electronically excited 1-CNN+ ions. In these measurements, a few thousand 1-CNN+ ions were irradiated leading to the observation of a few hundred fragment ions. Spectra were plotted in terms of the appearance of the number of ions with m/z 126 and averaged over several scans,  .
.
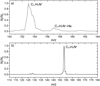 |
Fig. 1 CNN+ mass spectra. (a) Mass spectrum of 1-CNN+ stored in cold (Tnom = 4 K) and dense helium buffer gas. The peak at m/z 157 indicates the formation of 1-CNN+ - He. (b) Electron impact ionisation mass spectrum of 1-CNN used in this work. |
2.2 Computational
Calculations were performed using the Gaussian 16 software suite (Frisch et al. 2016). Optimised geometries, harmonic vibrational frequencies, and energies were calculated using density-functional theory and its time-dependant version for excited states, at the ωB97X-D/cc-pVDZ level of theory (Chai & Head-Gordon 2008; Dunning 1989). The Franck-Condon (FC) calculations presented in this article were performed with ezFCF (Gozem & Krylov 2022) using the Gaussian output files. The vibrational temperature was set to 6 K.
3 Results
Figure 2 shows an overview spectrum of 1-CNN+ - He recorded in the region 4300–7500 Å using an OPO. This data was obtained by monitoring the attenuation of ions with m/z 157 and covers the D2 ← D0 electronic band system of 1-CNN+ and the lowest energy part of D3 ← D0. The lowest energy doublet transition of 1-CNN+ is predicted to be much weaker and lie at wavelengths longer than 15 000 Å and was not experimentally investigated here. Data at λ > 7100 Å were recorded with the minimum OPO wavelength step size of 10 Å in this region. Figure 2 indicates that the D2 ← D0 transition is the most intense, with this result expected based on calculations presented here which predict f = 0.075 compared to f = 0.025 for D3 ← D0, and f = 0.004 for D1 ← D0.
Figure 3 shows the spectrum plotted as a function of energy from the origin band at 13 606 cm−1. The absorption feature assigned as the origin band carries most of the electronic band oscillator strength. The remaining intensity is contained within bands lying ~140, 500 and 1500 cm−1 to higher energy. These are likely to be caused by excitation to v = 1 of vibrational modes with these energies in D2, as indicated by the FC simulation, shown as a stick spectrum. The absorption 140 cm−1 to higher energy than the origin is due to in-plane bending of the CN group, while the other strong features around 500 and 1500 involve CC motion in the aromatic rings. Convolution of the stick spectrum with Lorentzian functions with full width at half maximum (FWHM) of 30 cm−1 leads to qualitative agreement with the experimental data. Note that the absolute transition energies of the simulation have all been shifted by ~100 cm−1 to lower energy to match the energy of the  transition. Overall, the simulation clearly captures the experimental pattern, confirming that the spectrum belongs to 1-CNN+ and enabling retrieval of its optical properties. One part of the spectrum is not reproduced well by the simulation; the region centred around 1000 cm−1 from the origin. A possibility for this discrepancy is due to Herzberg-Teller coupling, which is not included in the computational work but believed to be important for this system (Stockett et al. 2023).
The origin band and lowest energy part of the D2 ← D0 transition of 1-CNN+ – He was recorded at higher resolution using a dye laser. This is shown in Fig. 4, together with more direct a measurement on the bare ion. The latter data were obtained by monitoring the appearance of fragment ions at m/z 126 ( ). The activation energy for dissociation
  is reported as 3.16(4) eV by Stockett et al. (2023), similar to that determined previously (West et al. 2019). In the experiments presented here, the power of the OPO (probe) was increased to observe a few fragment counts per trapping cycle of one-colour fragmentation by irradiation at 4800 Å. Based on the discussion above, this must be caused by a two- or multiphoton process. By scanning the dye laser across the region 7000–7400 Å, a two-colour spectrum could be recorded, as shown in Fig. 4. For these measurements, typically a few hundred
  fragment ions were detected at 7343 Å. Inspection of Fig. 4 indicates that the two sets of data are in close agreement and that the perturbation to the electronic transition due to helium tagging is small relative to the width of the origin band.
The origin band possesses a FWHM of around 28 Å and is reproduced well using a Lorentzian function. Rotational structure is absent in both sets of data suggesting the width is predominately caused by the short lifetime of the excited electronic state (~0.1 ps). No significant changes to the origin band FWHM were observed upon increasing the trap temperature; data recorded at Tnom = 8,20 and 50 K are shown in Fig. 5. This is consistent with simulations carried out in PGOPHER (Western 2017) using the calculated rotational constants of 1-CNN+ in the ground (A, B, C = 1.47900,0.95212,0.57923 GHz) and excited (A, B, C = 1.44650,0.96035,0.57716 GHz) electronic states. This indicates that for a transition broadened due to a sub-picosecond lifetime, no significant broadening or displacement of the band centre is observed in the temperature range from 8 to 100 K.
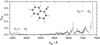 |
Fig. 2 Photofragmentation spectrum of 1-CNN+ – He recorded by monitoring the attenuation of ions with m/z 157. The spectral region investigated covers the D2 ← D0 transition of 1-CNN+ and part of D3 ← D0. |
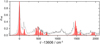 |
Fig. 3 Photofragmentation spectrum of 1-CNN+ – He recorded by monitoring the attenuation of ions with m/z 157 (black). Franck-Condon simulation (red lines) and convolution with 30 cm−1 FWHM Lorentzian functions also shown. |
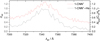 |
Fig. 4 Comparison of origin band of D2 ← D0 recorded by helium tagging (black) and by two-colour fragmentation (red). |
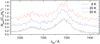 |
Fig. 5 Two-colour fragmentation spectrum of 1-CNN+ recorded at 8 (black), 20 (blue) and 50 K (red). Data were obtained by monitoring the appearance of |

4 Astrochemical implications
1-CNN is detected in TMC-1 via rotational spectroscopy in emission. Its abundance in these dense regions of the ISM is higher than predicted based on astrochemical modelling that includes in situ bottom-up formation routes (McGuire et al. 2021). It is assumed that the inability of small PAHs to radiatively stabilise upon UV photon absorption will limit their abundance in diffuse regions of the ISM (Chabot et al. 2019). However, recently, laboratory studies on the cation 1-CNN+ indicate stability against destructive processes in diffuse regions of the ISM exposed to UV radiation, through RF (Stockett et al. 2023). This points to the possibility that some of the population of small PAHs observed in dense clouds such as TMC-1 may derive from population in the diffuse ISM. Electronic spectroscopy in absorption can be used to test this hypothesis and evaluate the abundance of 1-CNN+ in diffuse clouds. The D2 ← D0 transition of 1-CNN+, reported here at low temperature in the gas phase, provides an opportunity to compare with astronomical observations of DIBs. The 28 Å FWHM of the origin band at 7343 Å means that a DIB is unlikely to be found in surveys carried out using échelle spectrographs, however, DIBs of this width have been revealed in earlier work and catalogued (Jenniskens & Désert 1994). For example, a DIB of similar broadness at 7357 Å has been reported by Herbig & Leka (1991). No DIB of the required FWHM is listed at 7343 Å, the wavelength of the origin band. However, it should be pointed out that observational data recorded using ground based telescopes are contaminated by a telluric H2O absorption system in this wavelength range (Sonnentrucker et al. 2018).
The lack of detection of DIBs due to 1-CNN+ leads to the question of its abundance. Upper limits to its column density can be estimated using the oscillator strength; calculations give f = 0.075 for the electronic band system. If f = 0.015 for the origin band, the column density can be evaluated using  , to be N = 2.8 × 1013 cm−2, assuming that W = 0.2 Å. This value of the equivalent width is taken from the detected 7357 DIB which possesses a similar FWHM. For W = 0.02Å, the upper limit would be N = 2.8 × 1012 cm−2. For comparison, the column density of
  in diffuse clouds toward HD 183143 is 2 × 1013 cm−2, which is similar to diatomics such as CH+. This situation resembles that found for the much larger PAH cation of hexabenzocoronene,
  (Campbell & Maier 2017b). In that study it is concluded that in order for PAHs with abundances of 1012 – 1013 cm−2 to be responsible for strong DIBs, the oscillator strength of their strongest absorptions needs to be much larger than f = 10−2, as also suggested by Omont (2016) for fullerene derivatives. Although this leaves room for significant abundance of these cations, the same conclusion can be reached for 1-CNN+.
5 Conclusions
Gas-phase electronic spectra of 1-CNN+ are reported following experiments using a cryogenic ion trapping apparatus. Two electronic band systems are observed in the visible/near IR. Computations indicate these are D2 ← D0 and D3 ← D0 transitions that possess oscillator strengths, f, of 0.075 and 0.025, respectively. The former transition is of interest for comparison with astronomical observations of DIBs. Its origin band at 7343 Å is the strongest absorption but falls in a spectral region contaminated by telluric water lines. As a result, space-based observations are required to assess the abundance of this ion in diffuse clouds. This could be achieved using the Hubble Space Telescope, as previously demonstrated in the detection of weak interstellar  absorptions (Cordiner et al. 2019), and observational time is being sought. Estimates reported here indicate that column densities of a few 1012 cm−2 would result in equivalent widths of a few tens of mÅ to be detected in future observations. The FWHM of this feature is found to be around 28 Å in the laboratory and shows no dependence on temperature in the range 10–50 K. The assessment of the CNN+ abundance in diffuse regions of the ISM is of importance due to the recent detection of the neutral species in TMC-1 and laboratory work that revealed a high stability of the cation.
Acknowledgements
The authors acknowledge financial assistance from the Royal Society [grant numbers RGF/EA/181035, EP/W03753X/1, URF/R1/180162] and Engineering and Physical Sciences Research Council [grant number EP/W03753X/1]. U.J. has used the HPC resources from the “Mésocentre” computing center of CentraleSupélec and École Normale Supérieure Paris-Saclay supported by CNRS and Région Île-de-France (http://mesocentre.centralesupelec.fr/). This article is based upon work from COST Action CA21126 - Carbon molecular nanostructures in space (NanoSpace), supported by COST (European Cooperation in Science and Technology).
References
- Allamandola, L. J., Tielens, A. G. G. M., & Barker, J. R. 1989, ApJS, 71, 733 [Google Scholar]
- Biennier, L., Salama, F., Allamandola, L. J., & Scherer, J. J. 2003, J. Chem.Phys., 118, 7863 [NASA ADS] [CrossRef] [Google Scholar]
- Biennier, L., Salama, F., Gupta, M., & O’Keefe, A. 2004, Chem. Phys. Lett., 387, 287 [NASA ADS] [CrossRef] [Google Scholar]
- Bréchignac, P., & Pino, T. 1999, A&A, 343, L49 [NASA ADS] [Google Scholar]
- Bréchignac, P., Pino, T., & Boudin, N. 2001, Spectrochim. Acta A Mol. Biomol.Spectrosc., 57, 745 [CrossRef] [Google Scholar]
- Campbell, E. K., & Maier, J. 2017a, J. Chem. Phys., 146, 160901 [CrossRef] [Google Scholar]
- Campbell, E. K., & Maier, J. P. 2017b, ApJ, 850, 69 [NASA ADS] [CrossRef] [Google Scholar]
- Campbell, E. K., Holz, M., Gerlich, D., & Maier, J. 2015, Nature, 532, 322 [CrossRef] [Google Scholar]
- Campbell, E. K., Holz, M., Maier, J., et al. 2016, ApJ, 822, 17 [NASA ADS] [CrossRef] [Google Scholar]
- Chabot, M., Béroff, K., Dartois, E., Pino, T., & Godard, M. 2019, ApJ, 888, 17 [NASA ADS] [CrossRef] [Google Scholar]
- Chai, J.-D., & Head-Gordon, M. 2008, Phys. Chem. Chem. Phys., 10, 6615 [NASA ADS] [CrossRef] [Google Scholar]
- Cordiner, M. A., Linnartz, H., Cox, N. L. J., et al. 2019, ApJS, 875, L28 [Google Scholar]
- Dryza, V., Sanelli, J. A., Robertson, E. G., & Bieske, E. J. 2012, J. Phys. Chem.A, 116, 4323 [CrossRef] [Google Scholar]
- Duley, W. W. 2006, Faraday discuss., 133, 415 [NASA ADS] [CrossRef] [Google Scholar]
- Duley, W. W., & Williams, D. A. 1981, MNRAS, 196, 269 [NASA ADS] [CrossRef] [Google Scholar]
- Dunning, T. H. 1989, J. Chem. Phys., 90, 1007 [Google Scholar]
- Ekern, S. P., Marshall, A. G., Szczepanski, J., & Vala, M. 1998, J. Phys. Chem.A, 102, 3498 [CrossRef] [Google Scholar]
- Frisch, M. J., Trucks, G. W., Schlegel, H. B., et al. 2016, Gaussian 16 RevisionC.01 (Wallingford CT: Gaussian Inc.) [Google Scholar]
- Gozem, S., & Krylov, A. I. 2022, Wiley Interdiscip. Rev. Comput. Mol. Sci., 12, e1546 [CrossRef] [Google Scholar]
- Gredel, R., Carpentier, Y., Rouillé, G., et al. 2011, A&A, 530, A26 [CrossRef] [EDP Sciences] [Google Scholar]
- Halasinski, T. M., Weisman, J. L., Ruiterkamp, R., et al. 2003, J. Phys. Chem. A, 107, 3660 [Google Scholar]
- Hardy, F.-X., Gause, O., Rice, C. A., & Maier, J. P. 2013, ApJ, 778, L30 [NASA ADS] [CrossRef] [Google Scholar]
- Hardy, F.-X., Rice, C. A., & Maier, J. P. 2017, ApJ, 836, 37 [NASA ADS] [CrossRef] [Google Scholar]
- Herbig, G. H., & Leka, K. D. 1991, ApJ, 382, 193 [NASA ADS] [CrossRef] [Google Scholar]
- Jenniskens, P., & Désert, F. X. 1994, A&AS, 106, 39 [NASA ADS] [Google Scholar]
- Kokkin, D. L., Troy, T. P., Nakajima, M., et al. 2008, ApJ, 681, L49 [NASA ADS] [CrossRef] [Google Scholar]
- Léger, A., & d’Hendecourt, L. 1985, A&A, 146, 81 [Google Scholar]
- Léger, A., & Puget, J. L. 1984, A&A, 137, L5 [Google Scholar]
- Léger, A., Boissel, P., & d’Hendecourt, L. 1988, Phys. Rev. Lett., 60, 921 [Google Scholar]
- Malloci, G., Mulas, G., & Joblin, C. 2004, A&A, 426, 105 [CrossRef] [EDP Sciences] [Google Scholar]
- Mattioda, A. L., Hudgins, D. M., & Allamandola, L. J. 2005, ApJ, 629, 1188 [NASA ADS] [CrossRef] [Google Scholar]
- McGuire, B. A. 2018, ApJS, 239, 17 [Google Scholar]
- McGuire, B. A., Loomis, R. A., Burkhardt, A. M., et al. 2021, Science, 371, 1265 [Google Scholar]
- McNaughton, D., Jahn, M. K., Travers, M. J., et al. 2018, MNRAS, 476, 5268 [CrossRef] [Google Scholar]
- Nitzan, A., & Jortner, J. 1979, J. Chem. Phys., 71, 3524 [NASA ADS] [CrossRef] [Google Scholar]
- Noble, J. A., Dedonder, C., & Jouvet, C. 2015, A&A, 577, A79 [NASA ADS] [CrossRef] [EDP Sciences] [Google Scholar]
- Omont, A. 2016, A&A, 590, A52 [NASA ADS] [CrossRef] [EDP Sciences] [Google Scholar]
- Patzer, A., Schütz, M., Jouvet, C., & Dopfer, O. 2013, J. Phys. Chem. A, 117, 9785 [NASA ADS] [CrossRef] [Google Scholar]
- Pino, T., Boudin, N., & Bréchignac, P. 1999, J. Chem. Phys., 111, 7337 [NASA ADS] [CrossRef] [Google Scholar]
- Pino, T., Féraud, G., Bréchignac, P., Bieske, E. J., & Schmidt, T. W. 2013, Proc.Int. Astron. Union, 9, 247 [CrossRef] [Google Scholar]
- Reizer, E., Viskolcz, B., & Fiser, B. 2022, Chemosphere, 291, 132793 [NASA ADS] [CrossRef] [Google Scholar]
- Rice, C. A., Hardy, F.-X., Gause, O., & Maier, J. P. 2014, J. Phys. Chem. Lett., 5, 942 [CrossRef] [Google Scholar]
- Roithová, J., Jasík, J., Del Pozo Melladoa, J., & Gerlich, D. 2019, Faraday Discuss., 217, 98 [CrossRef] [Google Scholar]
- Salama, F., & Ehrenfreund, P. 2013, Proc. Int. Astron. Union, 9, 364 [CrossRef] [Google Scholar]
- Salama, F., Galazutdinov, G. A., Krelowski, J., et al. 2011, ApJ, 728, 154 [NASA ADS] [CrossRef] [Google Scholar]
- Sellgren, K. 1984, ApJ, 277, 623 [Google Scholar]
- Sonnentrucker, P., York, B., Hobbs, L. M., et al. 2018, ApJS, 237, 40 [NASA ADS] [CrossRef] [Google Scholar]
- Stockett, M. H., Bull, J. N., Cederquist, H., et al. 2023, Nat. Commun., 14, 395 [CrossRef] [Google Scholar]
- Sukhorukov, O., Staicu, A., Diegel, E., et al. 2004, Chem. Phys. Lett., 386, 259 [NASA ADS] [CrossRef] [Google Scholar]
- Tielens, A. G. G. M. 2008, ARA&A, 46, 289 [NASA ADS] [CrossRef] [Google Scholar]
- Van der Zwet, G. P., & Allamandola, L. J. 1985, A&A, 146, 76 [Google Scholar]
- Walker, G., Bohlender, D., Maier, J., & Campbell, E. 2015, ApJ, 812, L8 [NASA ADS] [CrossRef] [Google Scholar]
- West, B. J., Lesniak, L., & Mayer, P. M. 2019, J. Phys. Chem. A, 123, 3569 [NASA ADS] [CrossRef] [Google Scholar]
- Western, C. M. 2017, J. Quant. Spectrosc. Radiat. Transfer, 186, 221 [NASA ADS] [CrossRef] [Google Scholar]
- Zhao, L., Kaiser, R. I., Xu, B., et al. 2018, Nat. Astron., 2, 973 [NASA ADS] [CrossRef] [Google Scholar]
- Zhen, J., Mulas, G., Bonnamy, A., & Joblin, C. 2016, Mol. Astrophys., 2, 12 [NASA ADS] [CrossRef] [Google Scholar]
All Figures
|
Fig. 1 CNN+ mass spectra. (a) Mass spectrum of 1-CNN+ stored in cold (Tnom = 4 K) and dense helium buffer gas. The peak at m/z 157 indicates the formation of 1-CNN+ - He. (b) Electron impact ionisation mass spectrum of 1-CNN used in this work. |
| In the text | |
|
Fig. 2 Photofragmentation spectrum of 1-CNN+ – He recorded by monitoring the attenuation of ions with m/z 157. The spectral region investigated covers the D2 ← D0 transition of 1-CNN+ and part of D3 ← D0. |
| In the text | |
|
Fig. 3 Photofragmentation spectrum of 1-CNN+ – He recorded by monitoring the attenuation of ions with m/z 157 (black). Franck-Condon simulation (red lines) and convolution with 30 cm−1 FWHM Lorentzian functions also shown. |
| In the text | |
|
Fig. 4 Comparison of origin band of D2 ← D0 recorded by helium tagging (black) and by two-colour fragmentation (red). |
| In the text | |
|
Fig. 5 Two-colour fragmentation spectrum of 1-CNN+ recorded at 8 (black), 20 (blue) and 50 K (red). Data were obtained by monitoring the appearance of |
| In the text | |
Current usage metrics show cumulative count of Article Views (full-text article views including HTML views, PDF and ePub downloads, according to the available data) and Abstracts Views on Vision4Press platform.
Data correspond to usage on the plateform after 2015. The current usage metrics is available 48-96 hours after online publication and is updated daily on week days.
Initial download of the metrics may take a while.