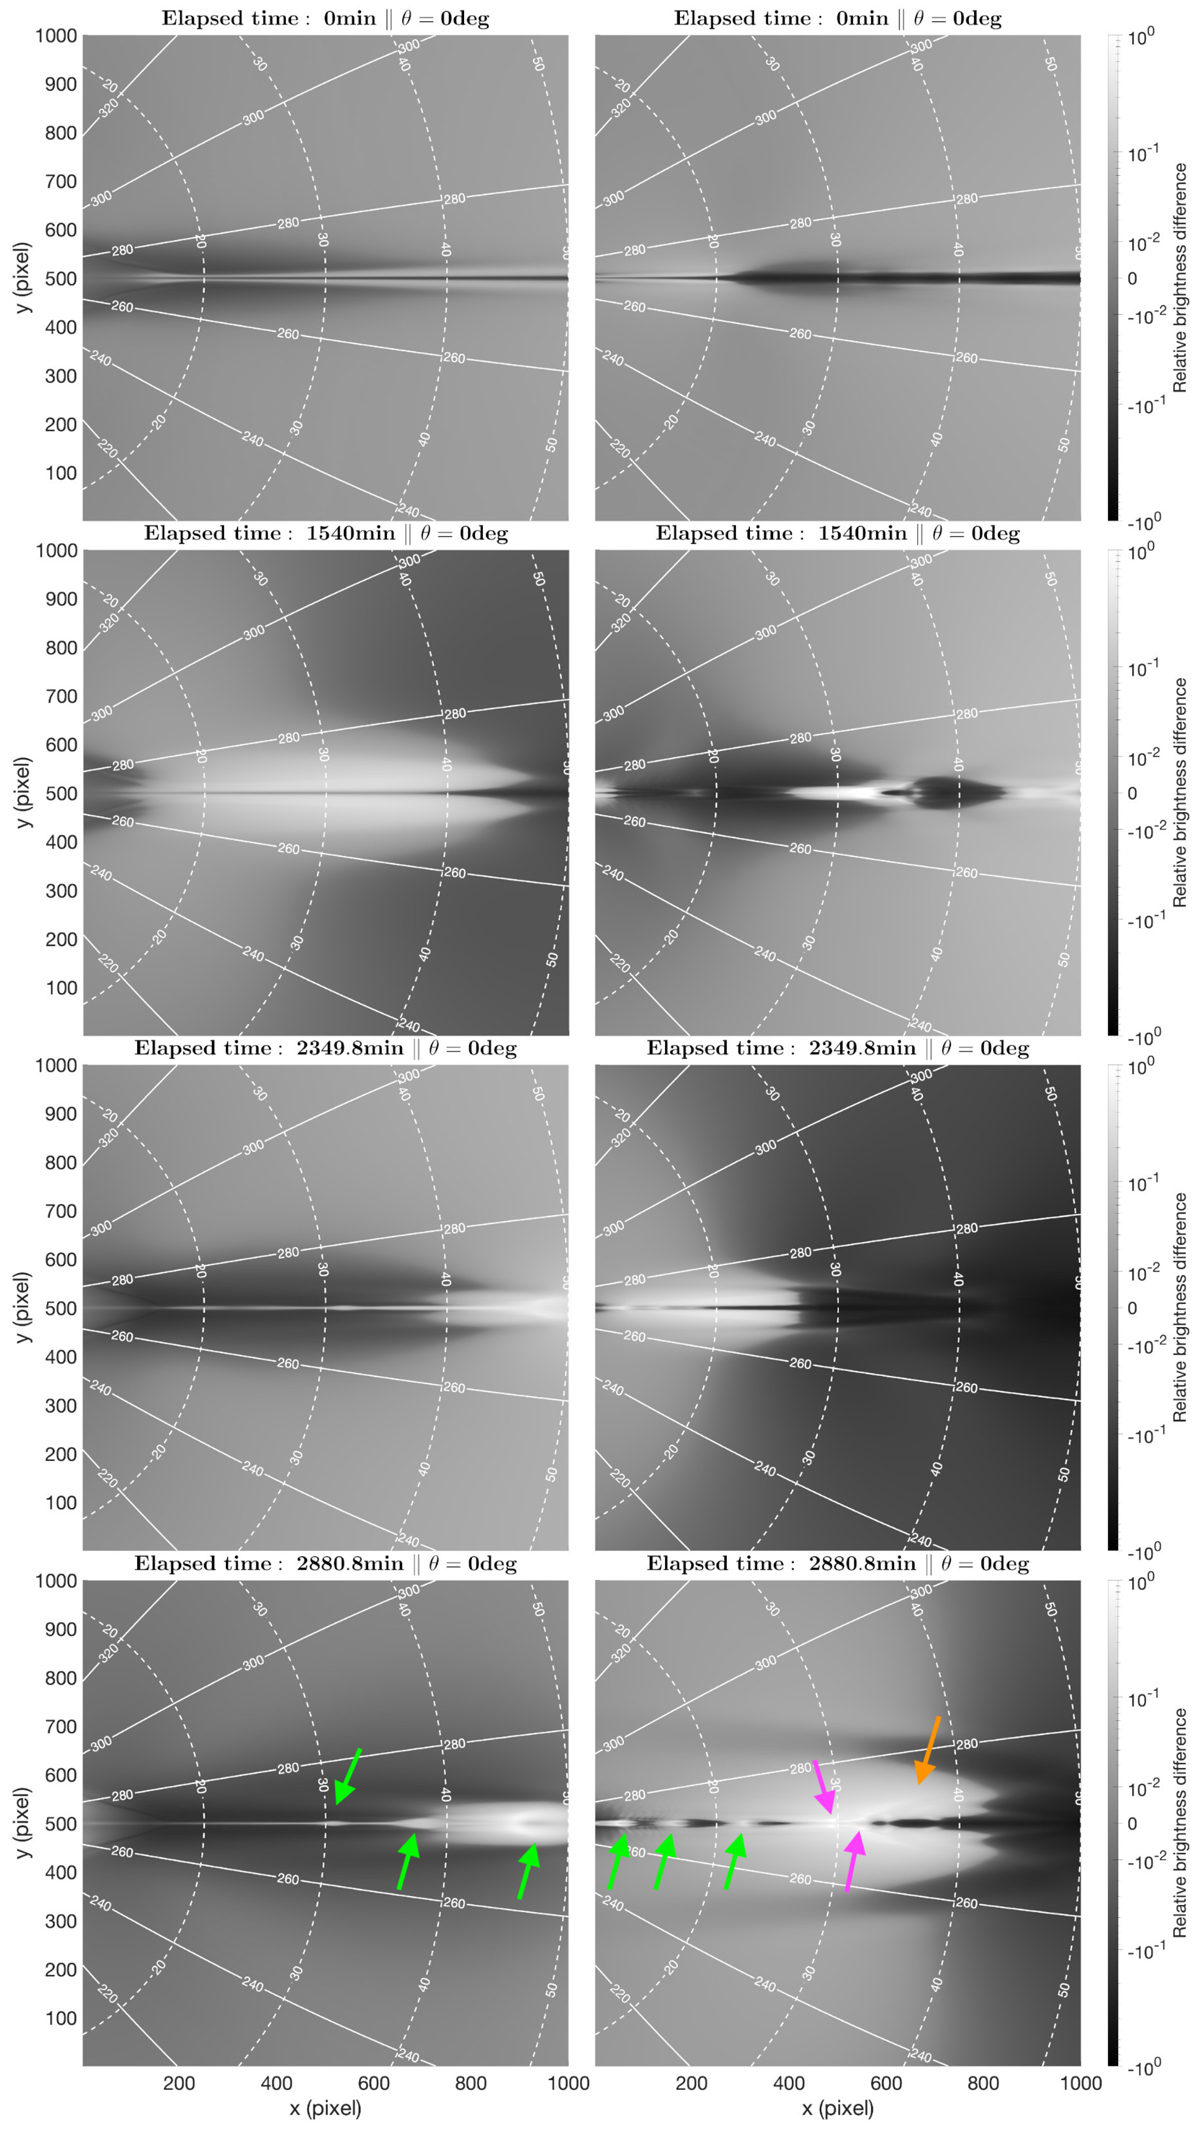
Fig. 8.
Download original image
Synthetic WISPR-I images. The images were produced from the idealistic dipolar set-up introduced in Sect. 3.1, using a layout similar to that in Fig. 6, assuming that PSP is located at 10 R⊙ (left column) and 35 R⊙ (right column). This figure depicts the case of a flat streamer seen edge-on by WISPR (θ = 0°). The relative brightness difference with the mean brightness computed over the full interval is colour plotted using a symmetrical logarithmic scale (with linear scale below a cut-off value of 10−2). Isolines of the position (ψ) and elongation (ϵ) angles (in degrees) are also plotted as solid and dashed white lines respectively. The coloured arrows point to transient structures (see main text for discussion). An animated version of this figure is available online.
Current usage metrics show cumulative count of Article Views (full-text article views including HTML views, PDF and ePub downloads, according to the available data) and Abstracts Views on Vision4Press platform.
Data correspond to usage on the plateform after 2015. The current usage metrics is available 48-96 hours after online publication and is updated daily on week days.
Initial download of the metrics may take a while.