Fig. 7.
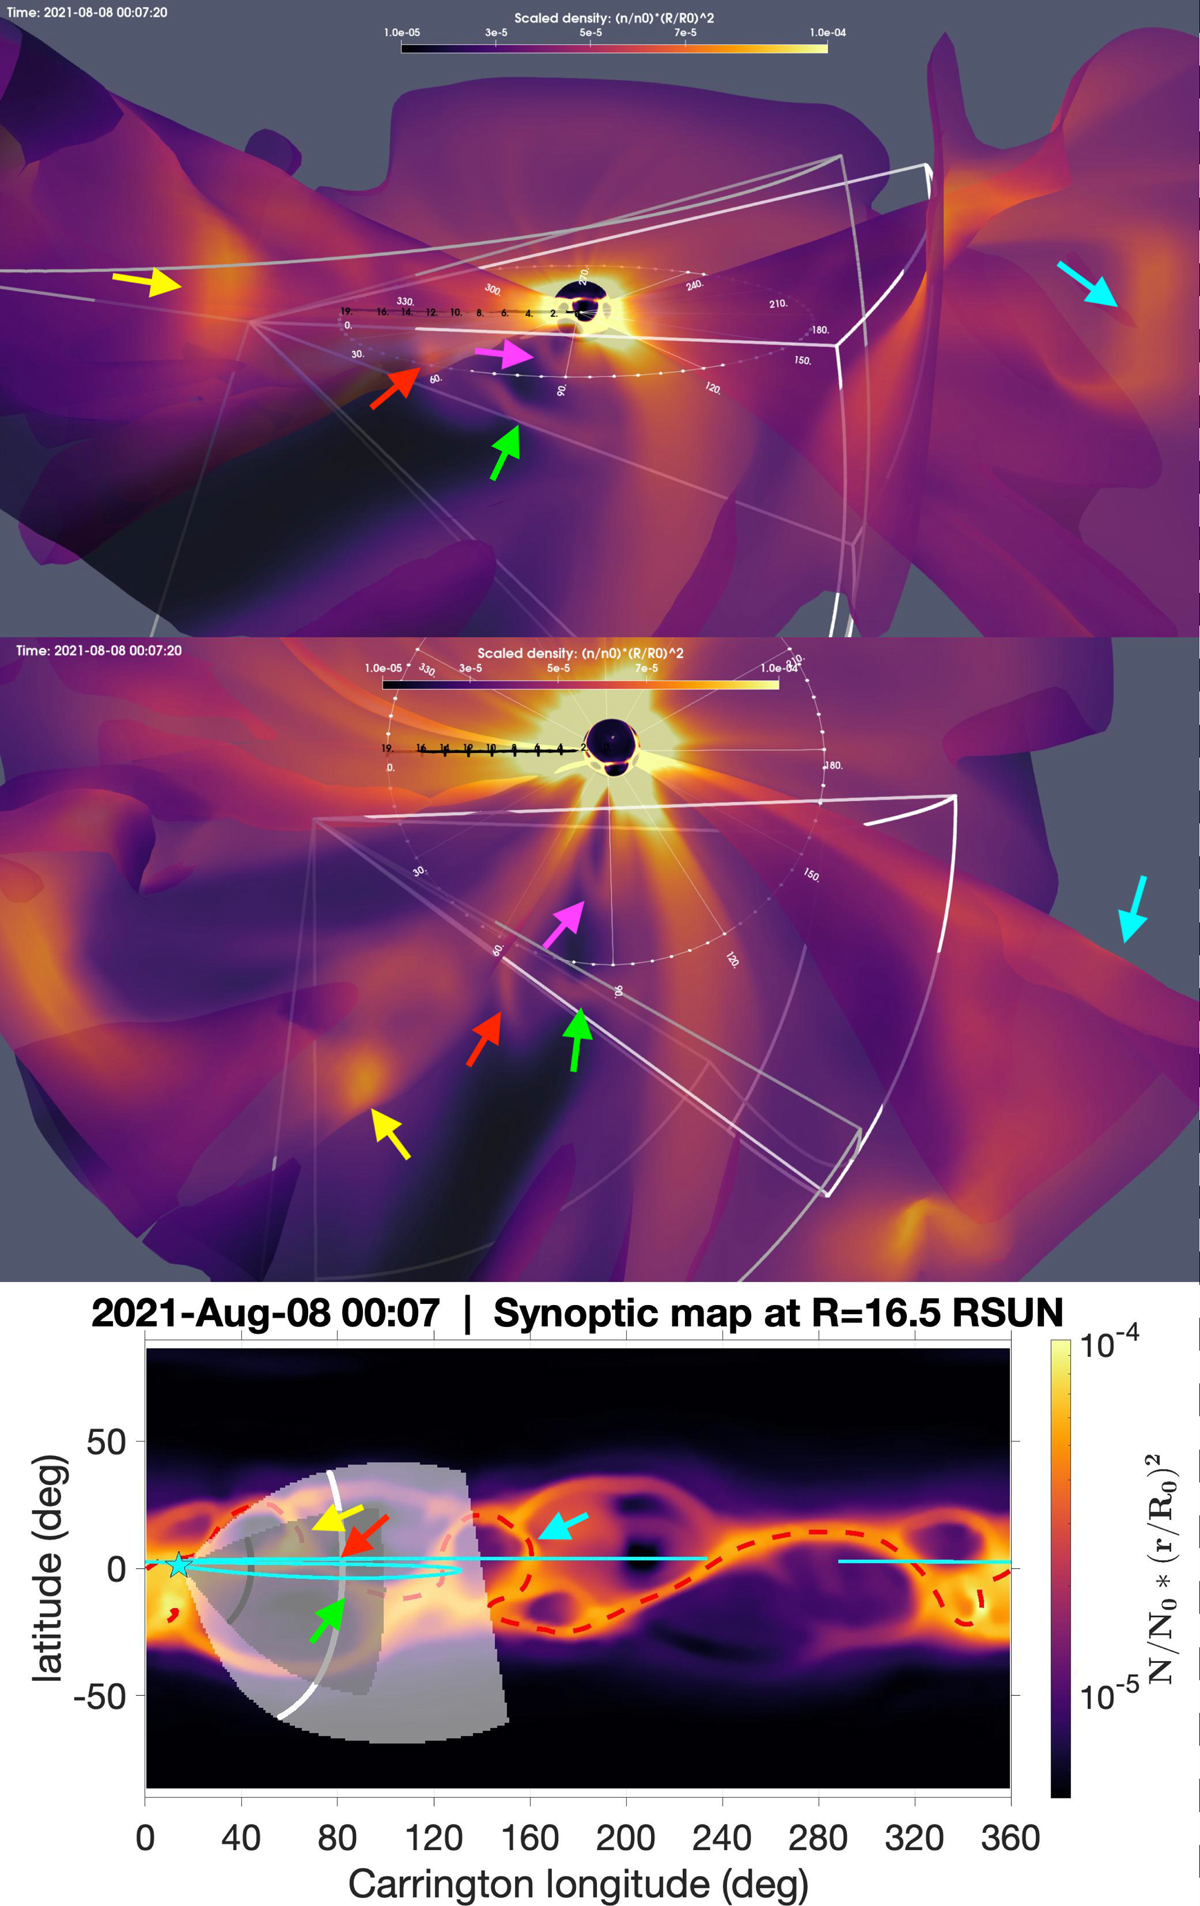
Download original image
Simulated density structures from the WindPredict-AW fully fledged 3D MHD model. Top two panels: front and top views of the 3D density structures propagating within the core of the (true) streamer belt (identified with a Br = 0 isosurface). Coordinates in the Carrington frame are also given, for the longitudes (lighter colours, in degrees) and radial distances (darker colours, in solar radii). Bottom panel: synoptic (Carrington) map at r = 16.5 R⊙ with PSP orbit plotted in cyan. To identify the true streamer belt from pseudo-streamer structures, a Br = 0 contour is plotted as a red dashed line. In both panels the FOV of WISPR-I and WISPR-O are shown in white and grey, respectively. In both panels the logarithmic colour scale represents the flux of plasma density scaled by its value at the inner boundary (r = 1.0002 R⊙). The coloured arrows point to flux rope structures (see main text for discussion). An animated version of this figure is available online.
Current usage metrics show cumulative count of Article Views (full-text article views including HTML views, PDF and ePub downloads, according to the available data) and Abstracts Views on Vision4Press platform.
Data correspond to usage on the plateform after 2015. The current usage metrics is available 48-96 hours after online publication and is updated daily on week days.
Initial download of the metrics may take a while.