Fig. 4.
Download original image
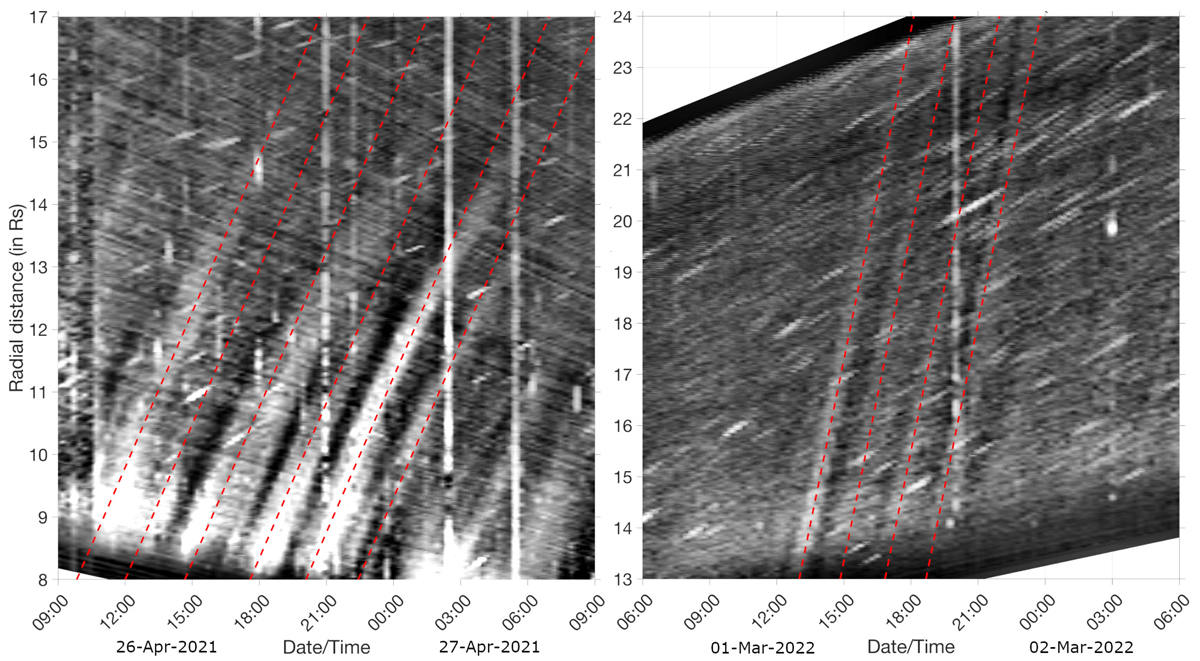
WISPR-I distance–time (J-)maps for the April 2021 (left) and March 2022 (right) events, and along the two slits shown in Fig. 2 (solid green lines). The fitted profiles are plotted as dashed red lines, with constant velocity of 160 km s−1 (left) and 415 km s−1 (right), i.e. about the solar wind bulk velocity measured a few days later by PSP-SWEAP/SPC in situ (see Fig. 5).
Current usage metrics show cumulative count of Article Views (full-text article views including HTML views, PDF and ePub downloads, according to the available data) and Abstracts Views on Vision4Press platform.
Data correspond to usage on the plateform after 2015. The current usage metrics is available 48-96 hours after online publication and is updated daily on week days.
Initial download of the metrics may take a while.