Fig. 3.
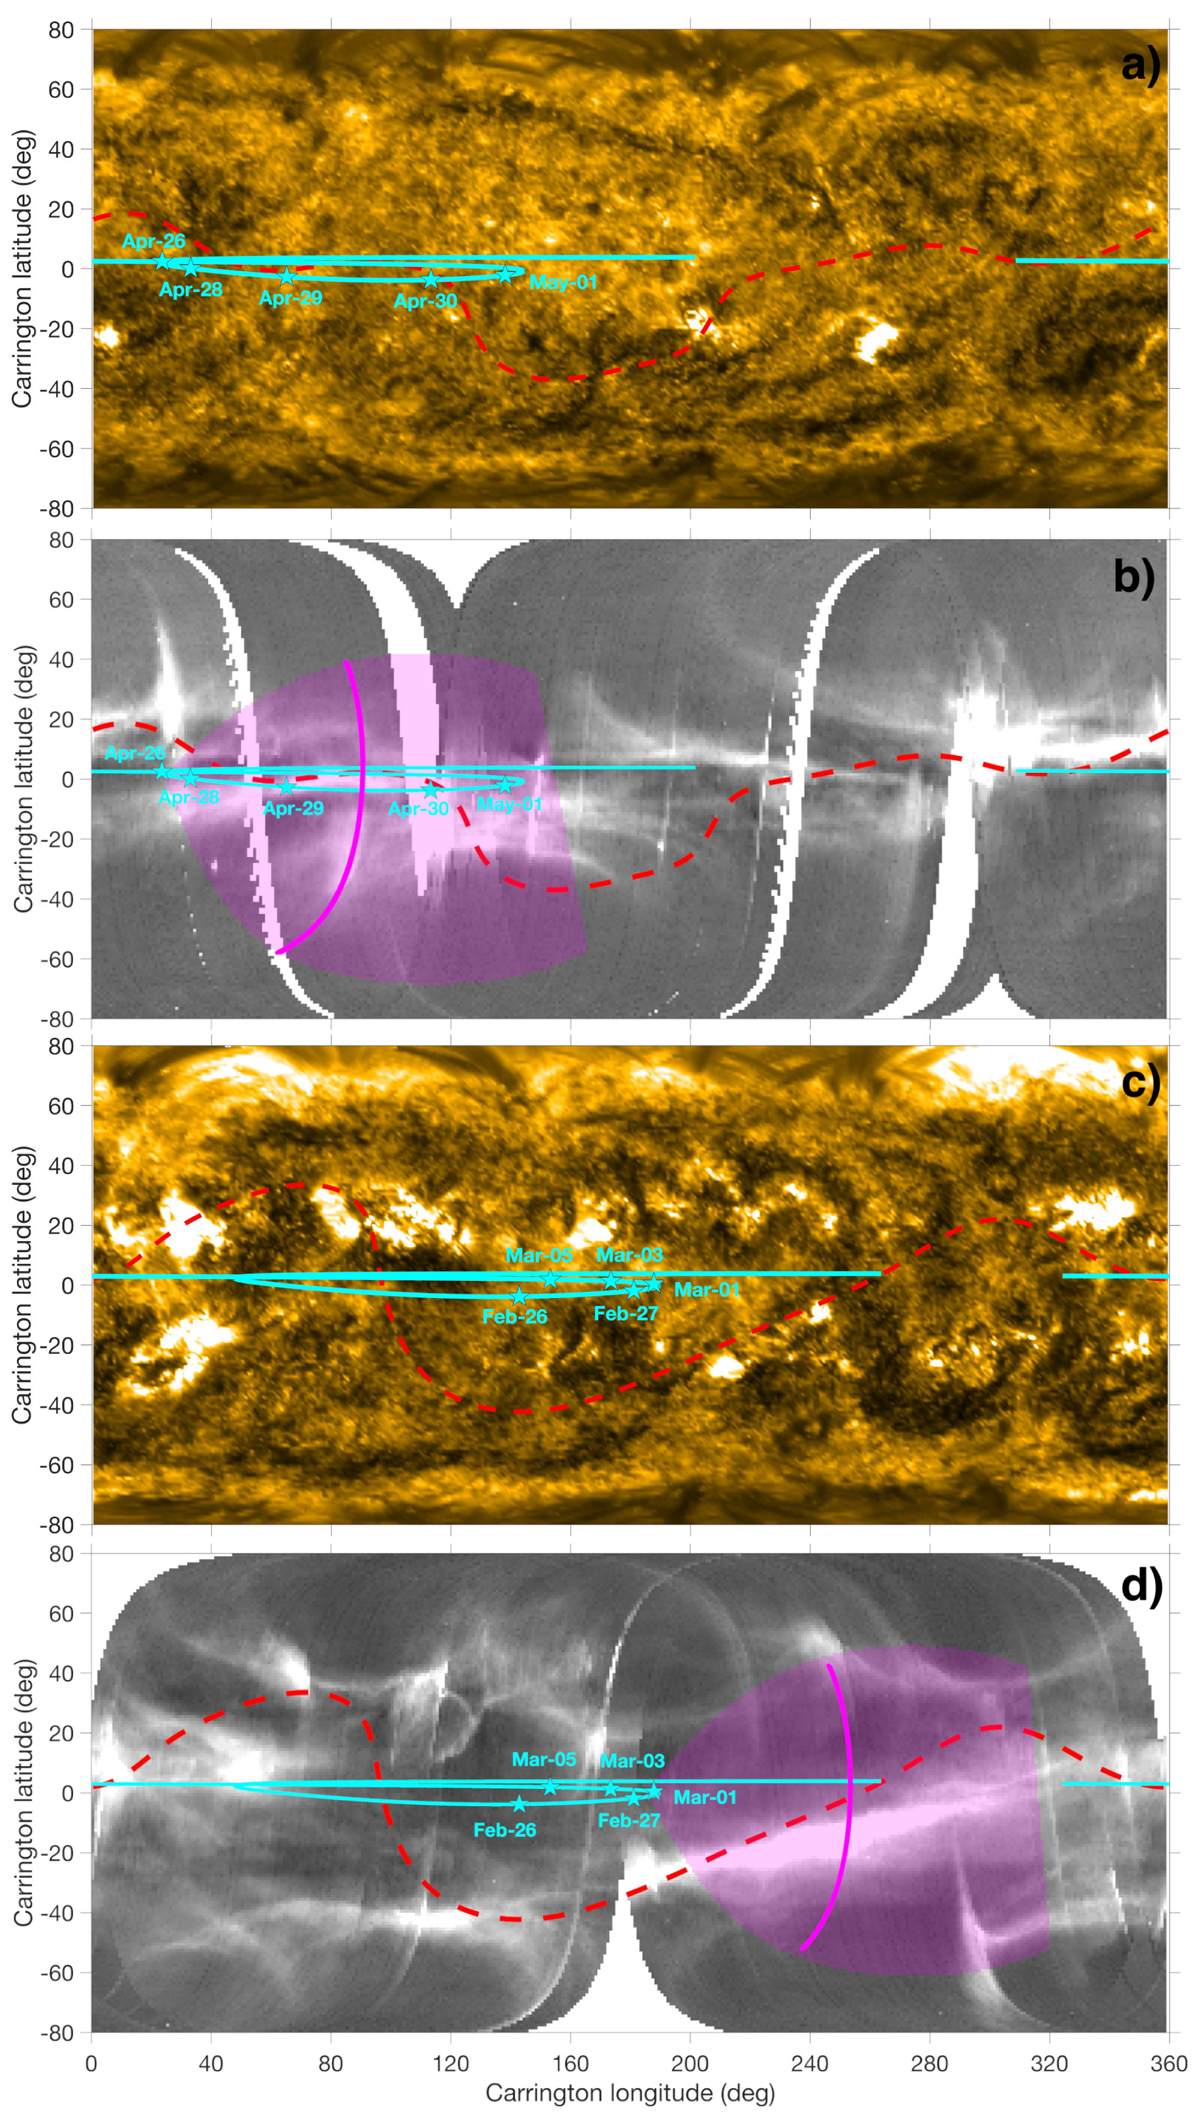
Download original image
Contextual imagery from near 1 AU. Panels a and c: Synoptic maps of the low solar atmosphere derived from SDO-AIA (171 Å) EUV observations. Panels b and d: synoptic maps of the WL corona as seen by the SoHO LASCO-C2 coronagraph. These maps have been produced by combining on-disk (off-limb) images over a full (half) solar rotation prior to the April 26, 2021 (panels a and b), and March 1, 2022 (panels c and d), events (see Sect. 4.2 of Rouillard et al. 2020b, for a description of the method). The dashed red line represents an estimate of the shape of the HCS derived from PFSS extrapolations of the photospheric magnetic field. Among the multitude of photospheric maps available we picked two maps that match both the shape of the WL streamer belt (see Poirier et al. 2021) and the timings of the HCS crossings determined from magnetic sector measurements taken in situ at PSP. In the present case, the magnetic maps from the Air Force Data Assimilative Photospheric flux Transport (ADAPT) model (Arge et al. 2010, 2011, 2013) for April 16 12:00 UT (8th realisation) and March 1 12:00 UT (11th realisation) were selected assuming a source surface height of 2.0 R⊙ and 2.5 R⊙, respectively. The vertical (radial) projection of PSP orbit onto the solar disk is plotted in cyan; the stars indicate several dates at PSP. The magenta surfaces represent the projections of the regions scanned by WISPR-I at the time of the two images shown in Fig. 2, with a solid line indicating the location of the Thomson sphere extracted at ϵ = 22°.
Current usage metrics show cumulative count of Article Views (full-text article views including HTML views, PDF and ePub downloads, according to the available data) and Abstracts Views on Vision4Press platform.
Data correspond to usage on the plateform after 2015. The current usage metrics is available 48-96 hours after online publication and is updated daily on week days.
Initial download of the metrics may take a while.