Fig. 2.
Download original image
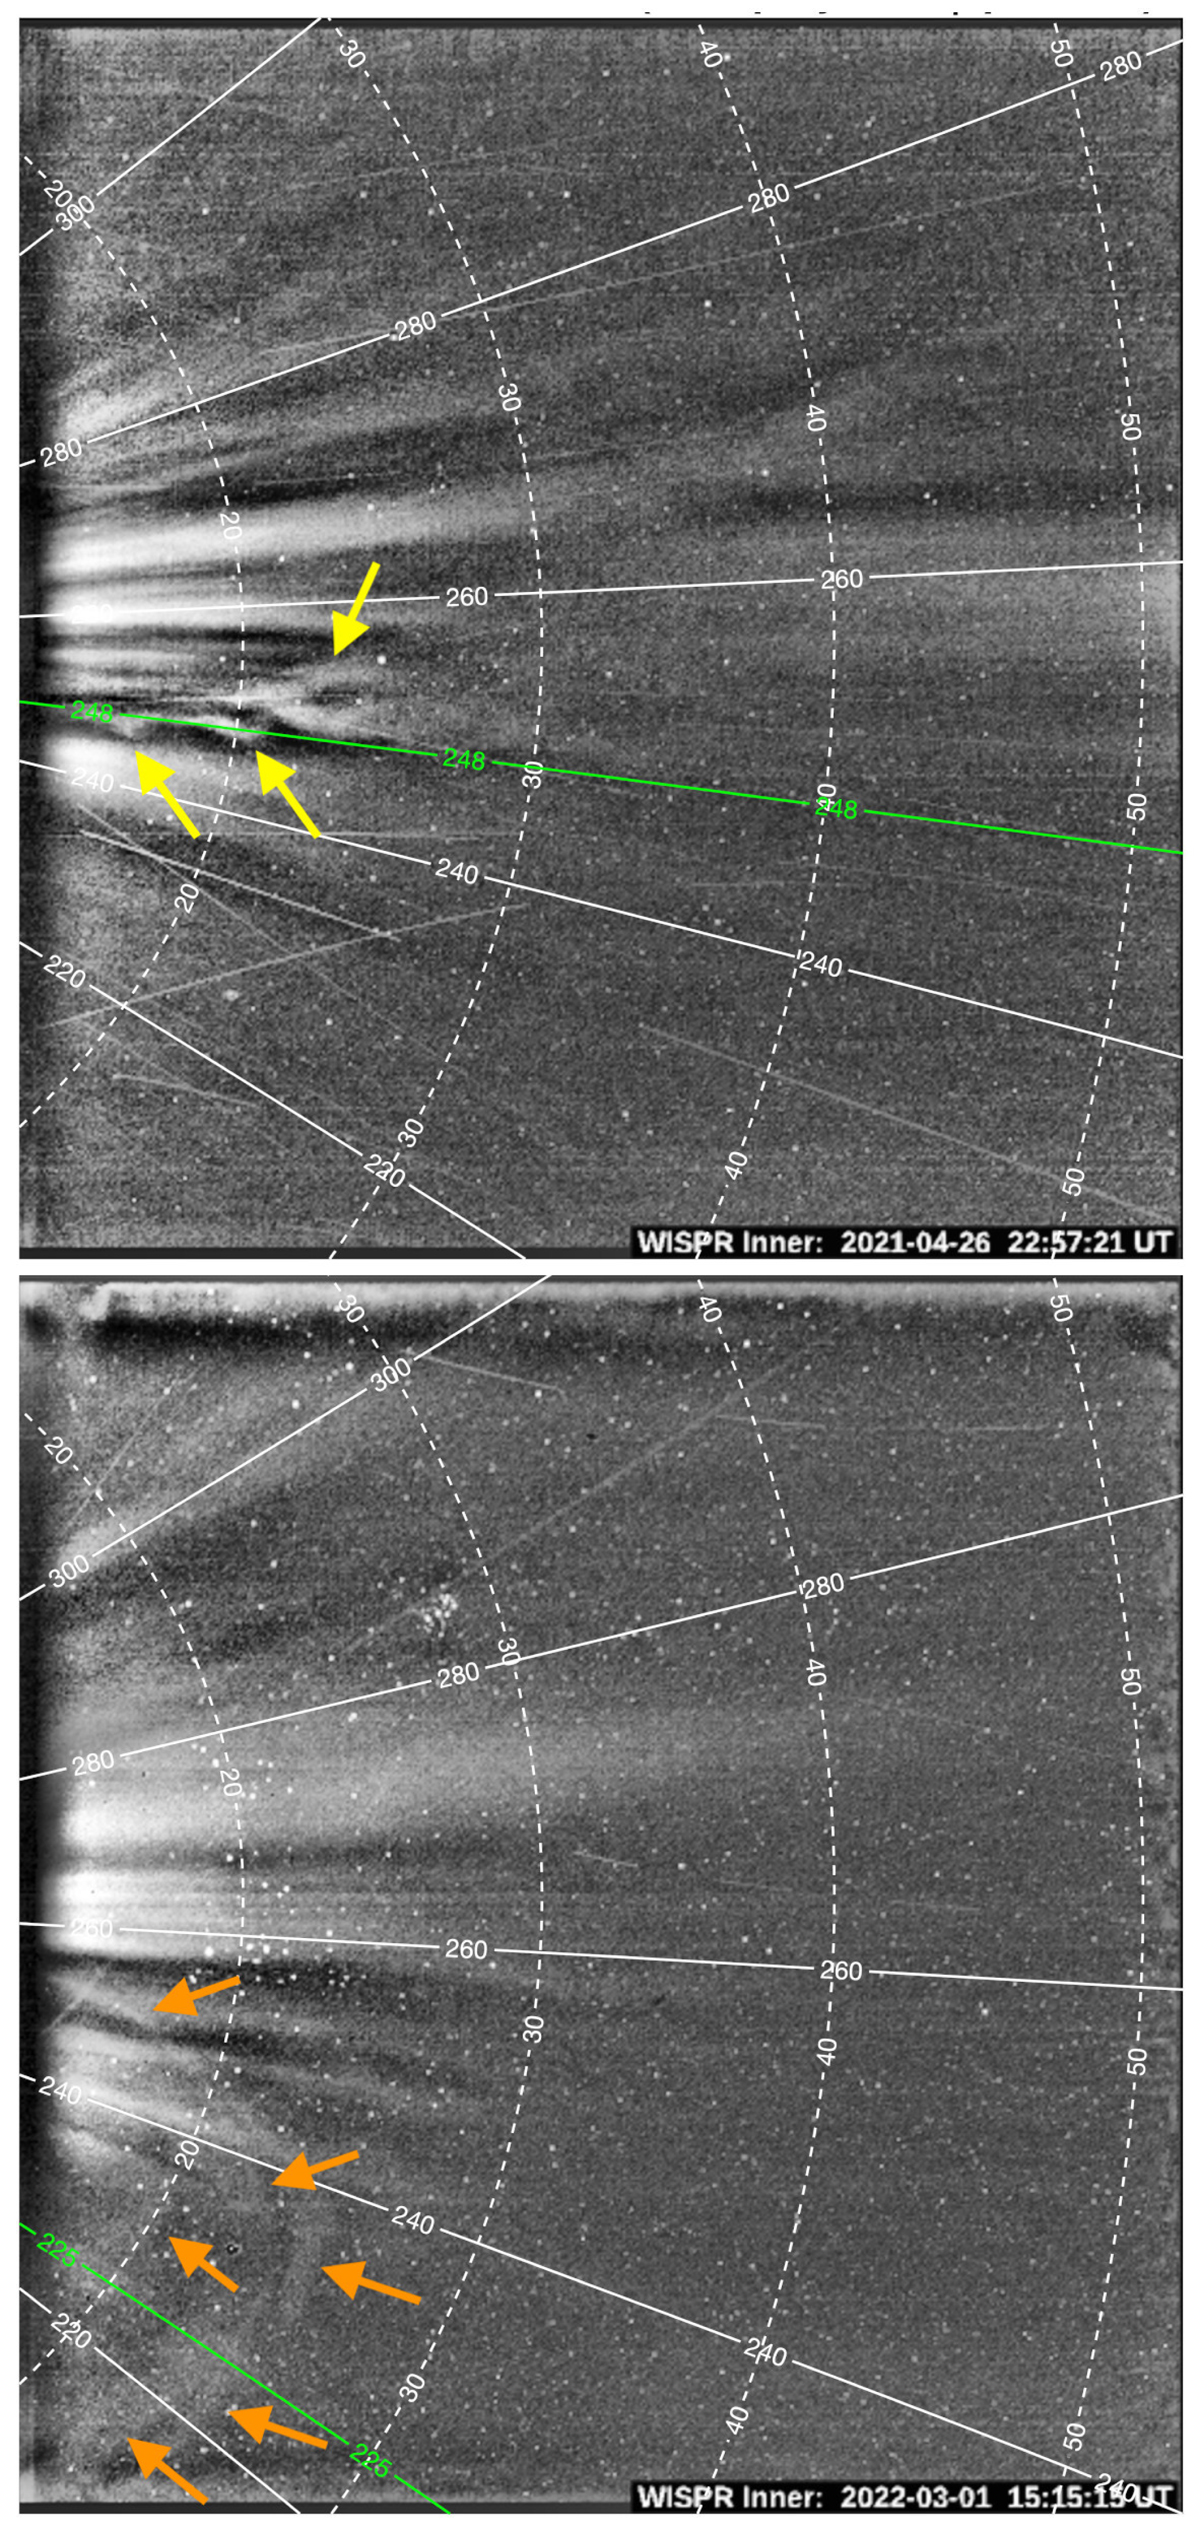
Two examples of small-scale density structures observed by WISPR-I on April 26, 2021, 22:57 UT (top) and March 1, 2022, 15:15 UT (bottom). The helioprojective-radial coordinate grid is again represented in the same format as in Fig. 1. The green lines represent the pixels extracted to build the time–distance (J-)maps shown in Fig. 4.
Current usage metrics show cumulative count of Article Views (full-text article views including HTML views, PDF and ePub downloads, according to the available data) and Abstracts Views on Vision4Press platform.
Data correspond to usage on the plateform after 2015. The current usage metrics is available 48-96 hours after online publication and is updated daily on week days.
Initial download of the metrics may take a while.