Fig. 11.
Download original image
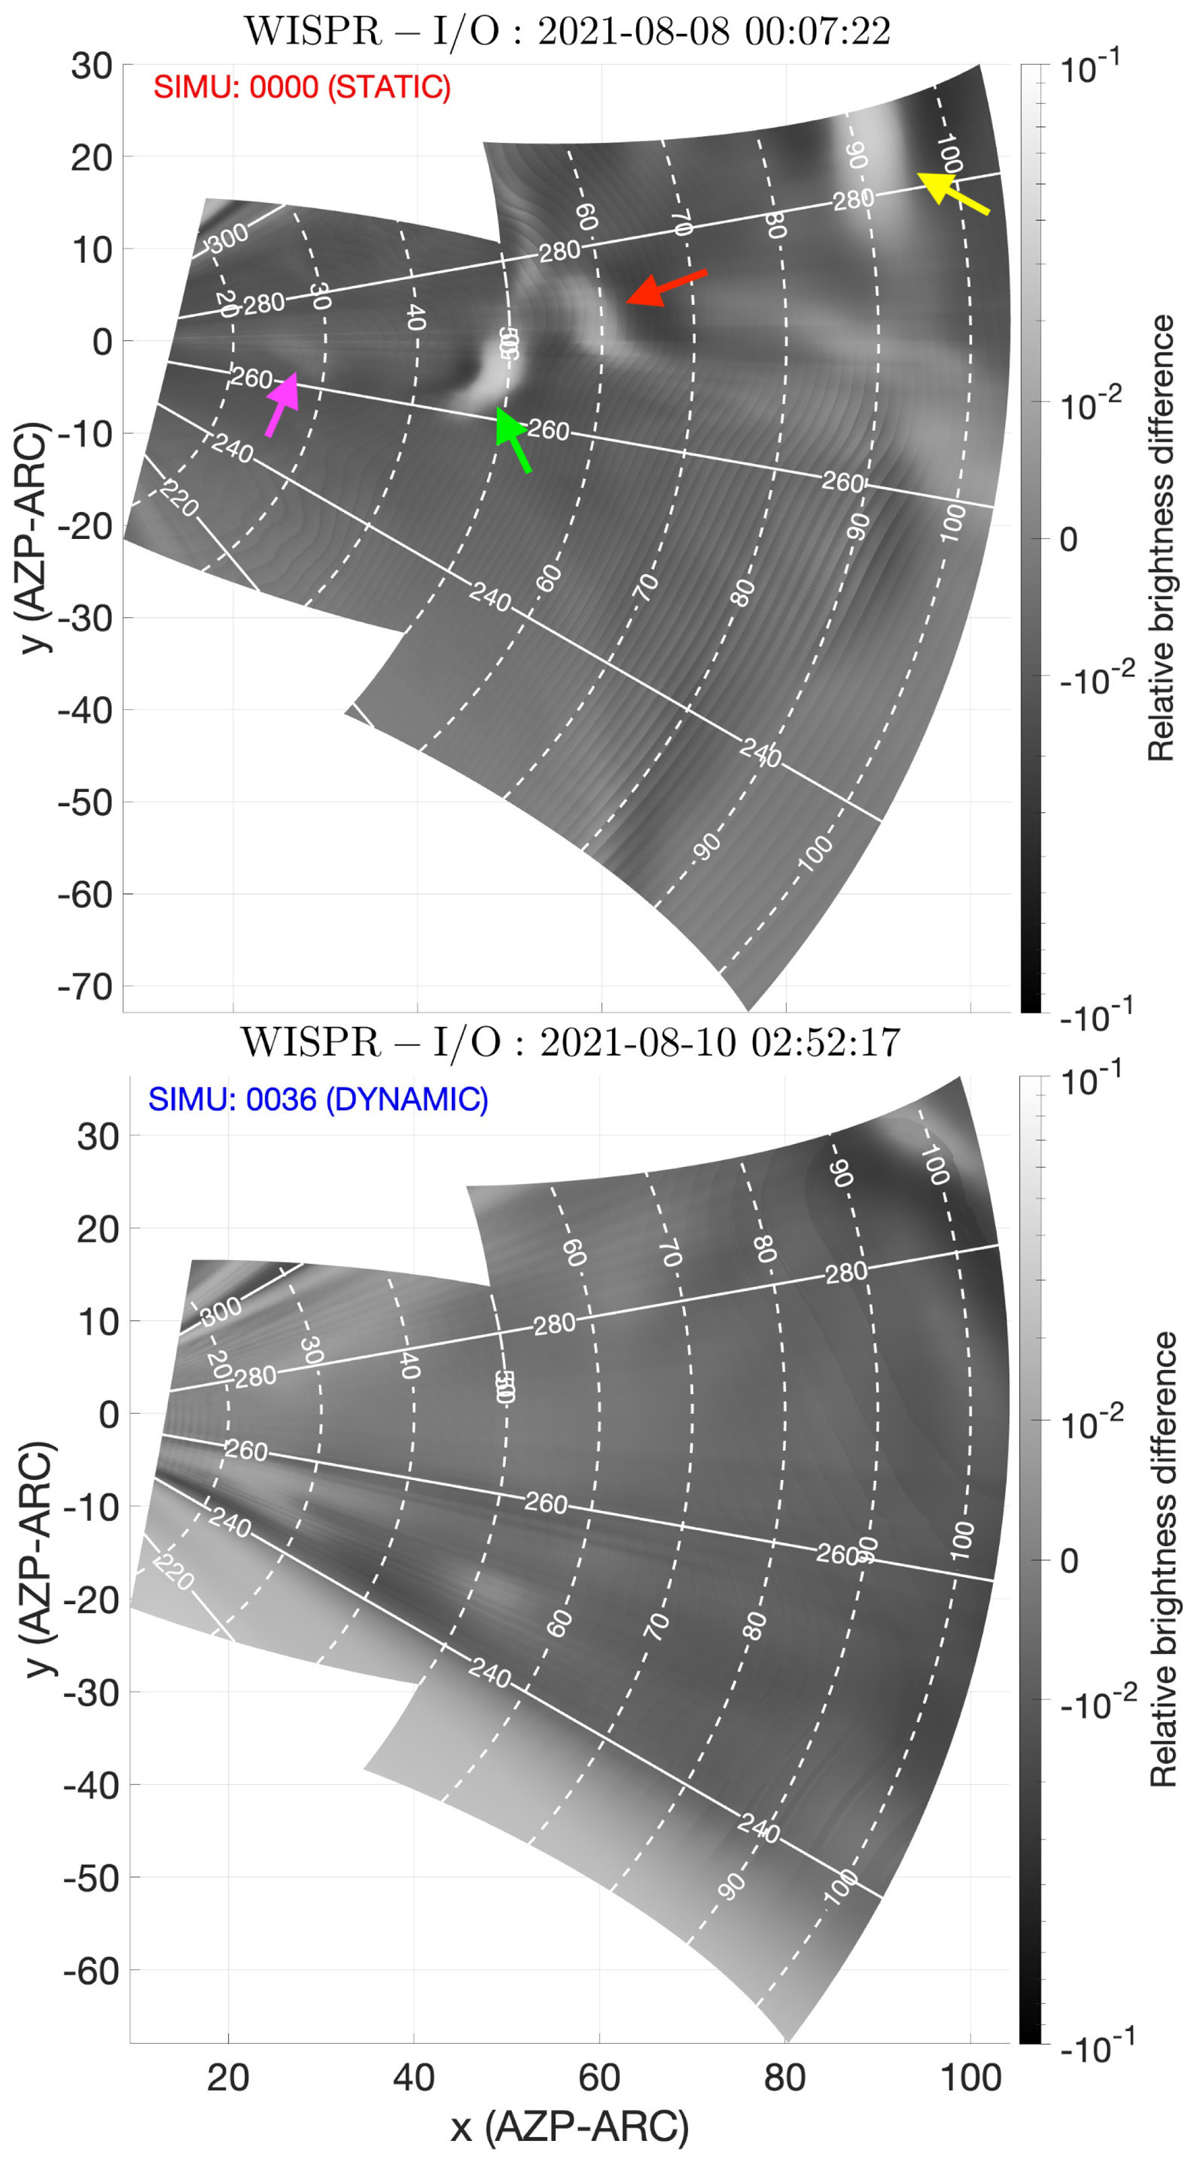
Synthetic images of inner WISPR-I and outer WISPR-O telescopes combined. The images were produced with the fully fledged 3D simulation set-up introduced in Sect. 3.2. A mean background was subtracted from each image using a sliding temporal window ranging ≈5 − 10 h (running difference method). The relative brightness difference to this mean background is colour plotted with a symmetrical logarithmic scale (with linear scale below a cut-off value of 10−2). As the simulation is ≈22 h long, only a short temporal window around perihelion could be treated in a self-consistent manner (dynamic mode). Outside this dynamic interval, images were then produced with either the first or last simulation snapshot (static mode). An animated version of this figure is available online.
Current usage metrics show cumulative count of Article Views (full-text article views including HTML views, PDF and ePub downloads, according to the available data) and Abstracts Views on Vision4Press platform.
Data correspond to usage on the plateform after 2015. The current usage metrics is available 48-96 hours after online publication and is updated daily on week days.
Initial download of the metrics may take a while.