Fig. 10.
Download original image
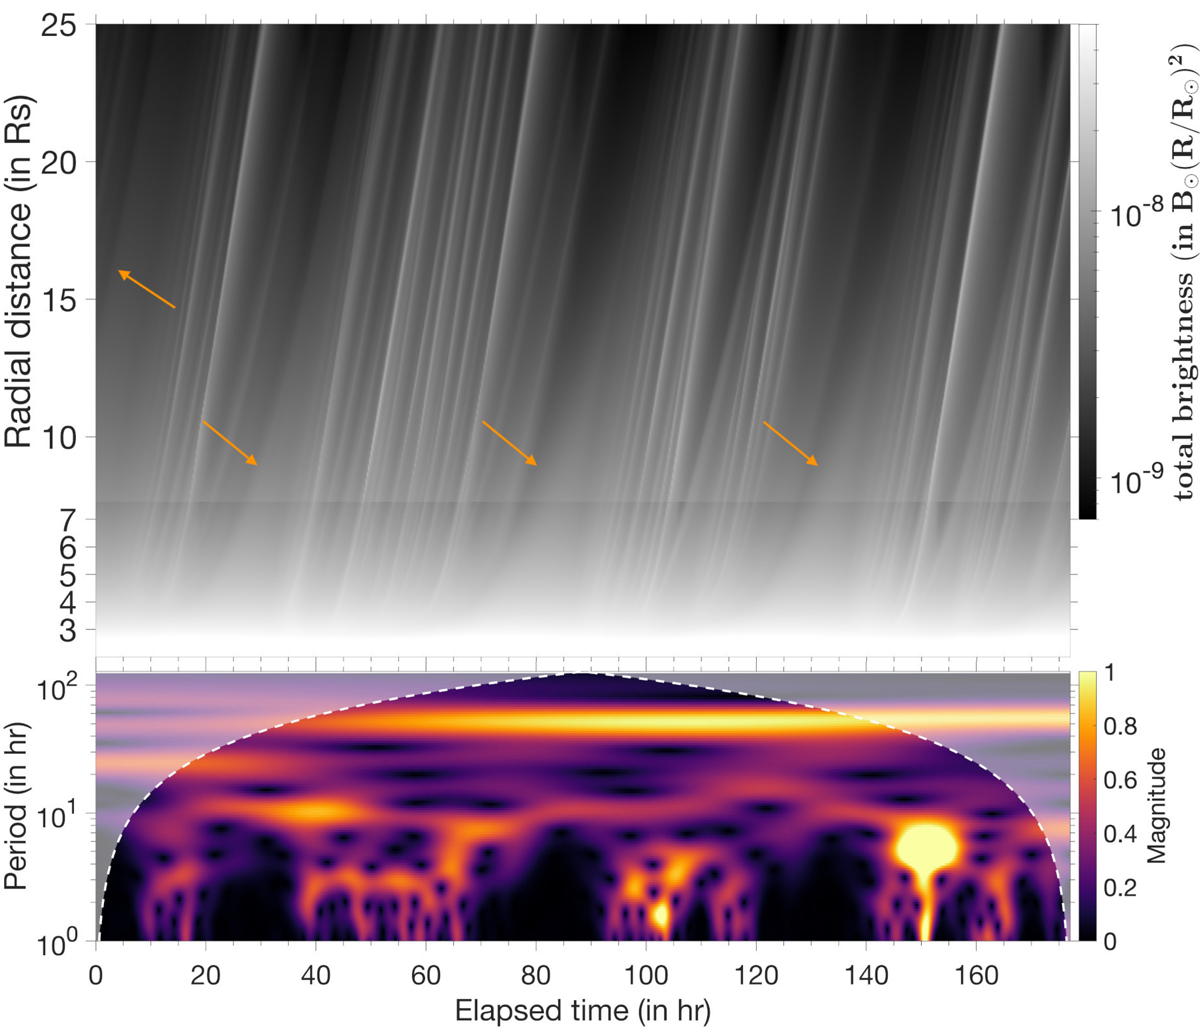
Time analysis of WL transients simulated from the idealistic dipolar set-up introduced in Sect. 3.1. Top panel: synthetic WISPR-I J-maps built from the two-image sequences shown in Fig. 8 and extracted along the solar equator (ψ = 270°). Bottom panel: associated period decomposition at r = 10 R⊙ using a 1D continuous wavelet transform (Morse wavelet, Torrence & Compo 1998).
Current usage metrics show cumulative count of Article Views (full-text article views including HTML views, PDF and ePub downloads, according to the available data) and Abstracts Views on Vision4Press platform.
Data correspond to usage on the plateform after 2015. The current usage metrics is available 48-96 hours after online publication and is updated daily on week days.
Initial download of the metrics may take a while.