Fig. 6
Download original image
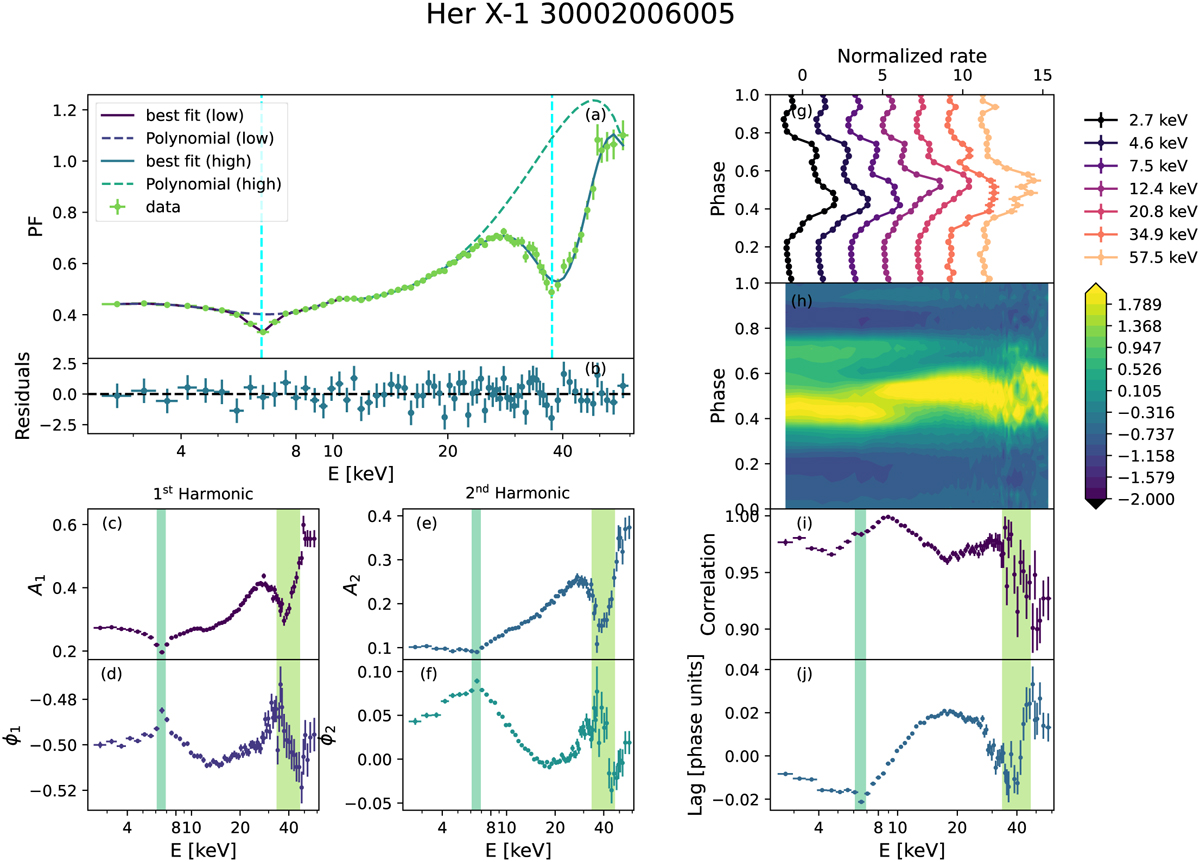
Pulse profile main properties for Her X-1 in ObsID 30002006005. Panel a: pulsed fraction (green points) and its best-fit model (solid lines); polynomial functions are also shown. Panel b: fit residuals. Panels c−f: phases and amplitudes of the first (A1, ϕ1) and second (A2, ϕ2) harmonics. The vertical colored bands indicate the energy and width of the Gaussian functions fitted to the pulsed fraction. Panel g: selection of normalized pulse profiles at equally logarithmic spaced energies, horizontally shifted for clarity. In each bin the pulse was normalized by subtracting the average and dividing by the standard deviation. Panel h: color-map representation of the normalized pulse profiles as a function of energy. The thin lines represent 20 equally-spaced contours. Panel i: cross-correlation between the pulse profile in each energy band and the average profile. Panel j: corresponding phase lag. The colored vertical bands are the same as in panels d−f.
Current usage metrics show cumulative count of Article Views (full-text article views including HTML views, PDF and ePub downloads, according to the available data) and Abstracts Views on Vision4Press platform.
Data correspond to usage on the plateform after 2015. The current usage metrics is available 48-96 hours after online publication and is updated daily on week days.
Initial download of the metrics may take a while.