Fig. 1
Download original image
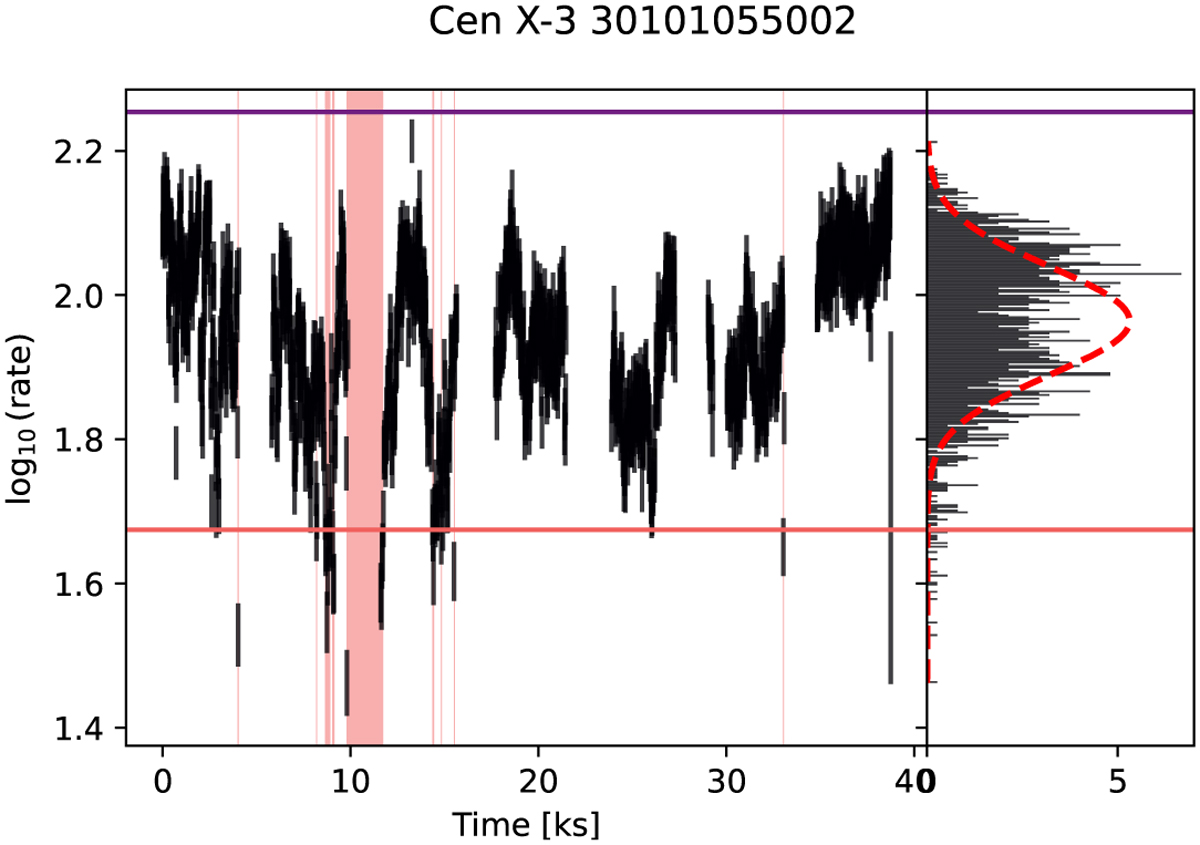
Filtering of Cen X-3 light curves using a log-normal distribution of counts in the 3–70 keV band (see Sect. 3.3). Left panel: light curve since the beginning of observation on 2015 November 30. The pink vertical bands indicate the excluded periods; the horizontal lines indicate the rate limits. Right panel: histogram of counts in logarithmic scale with horizontal lines indicating the adopted limits. We considered as good time intervals those encompassing the ±5σ deviations from the central peak value.
Current usage metrics show cumulative count of Article Views (full-text article views including HTML views, PDF and ePub downloads, according to the available data) and Abstracts Views on Vision4Press platform.
Data correspond to usage on the plateform after 2015. The current usage metrics is available 48-96 hours after online publication and is updated daily on week days.
Initial download of the metrics may take a while.