Open Access
Fig. C.2
Download original image
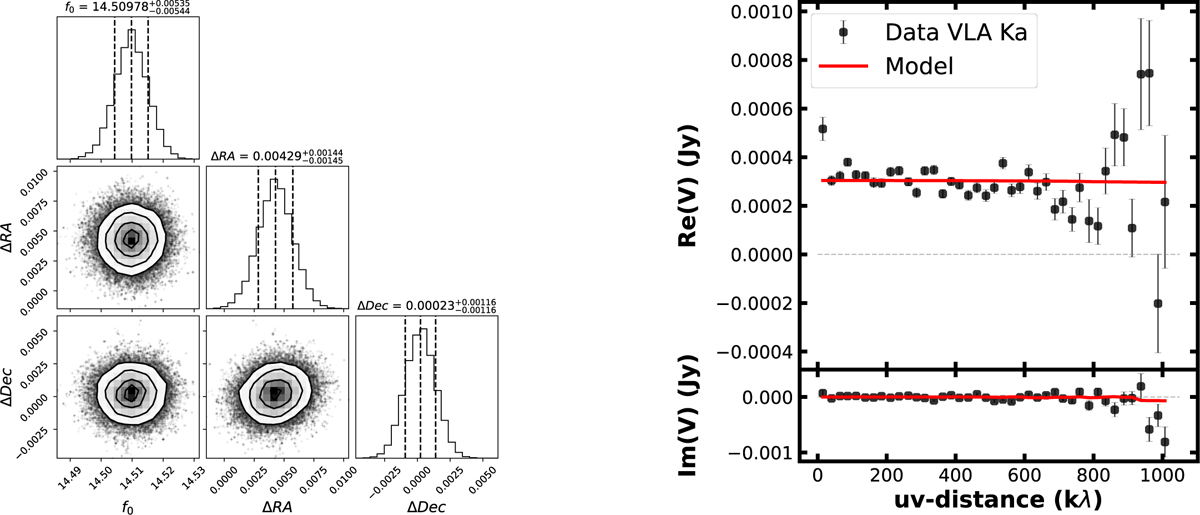
Results of the galario fit with a point source model on the VLA Ka-band (9.0 mm) data. Left panel: Corner plot of the MCMC run. Right panel: Recentered and deprojected visibilities binned in 25kλ intervals and the best-fit model. Error bars are at 1σ.
Current usage metrics show cumulative count of Article Views (full-text article views including HTML views, PDF and ePub downloads, according to the available data) and Abstracts Views on Vision4Press platform.
Data correspond to usage on the plateform after 2015. The current usage metrics is available 48-96 hours after online publication and is updated daily on week days.
Initial download of the metrics may take a while.