Fig. 3
Download original image
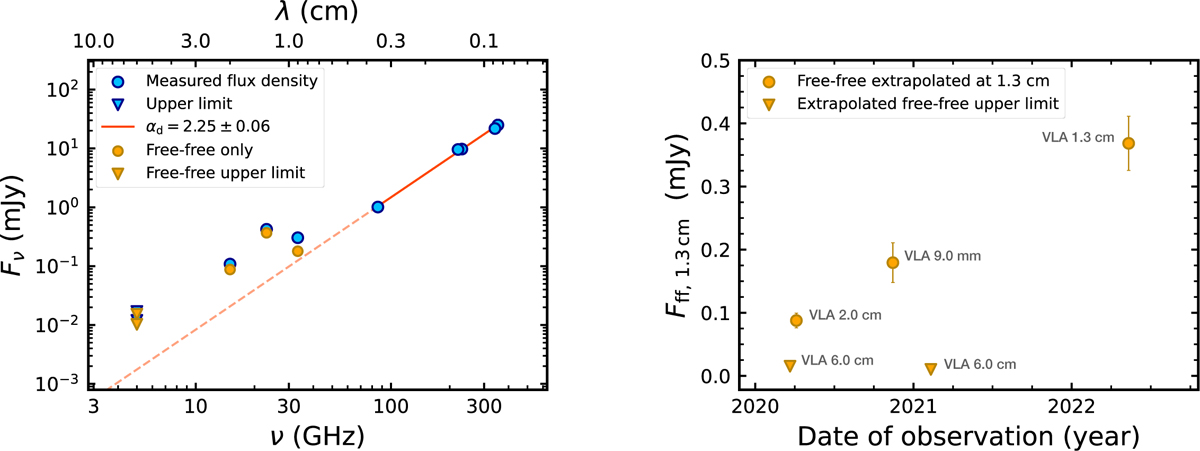
Extraction and time variability of the free-free component. Left panel: flux density distribution of CX Tau, showing the dust emission fit (orange line) used to extract the free-free only estimates (yellow circles and arrows) from the measured flux densities and upper limits. Right panel: time variability of extrapolated free-free estimates at 1.3 cm. The extrapolation was performed assuming a free-free spectral index of 0.7 ± 0.1. The values in the plot are labeled with the observation they came from originally.
Current usage metrics show cumulative count of Article Views (full-text article views including HTML views, PDF and ePub downloads, according to the available data) and Abstracts Views on Vision4Press platform.
Data correspond to usage on the plateform after 2015. The current usage metrics is available 48-96 hours after online publication and is updated daily on week days.
Initial download of the metrics may take a while.