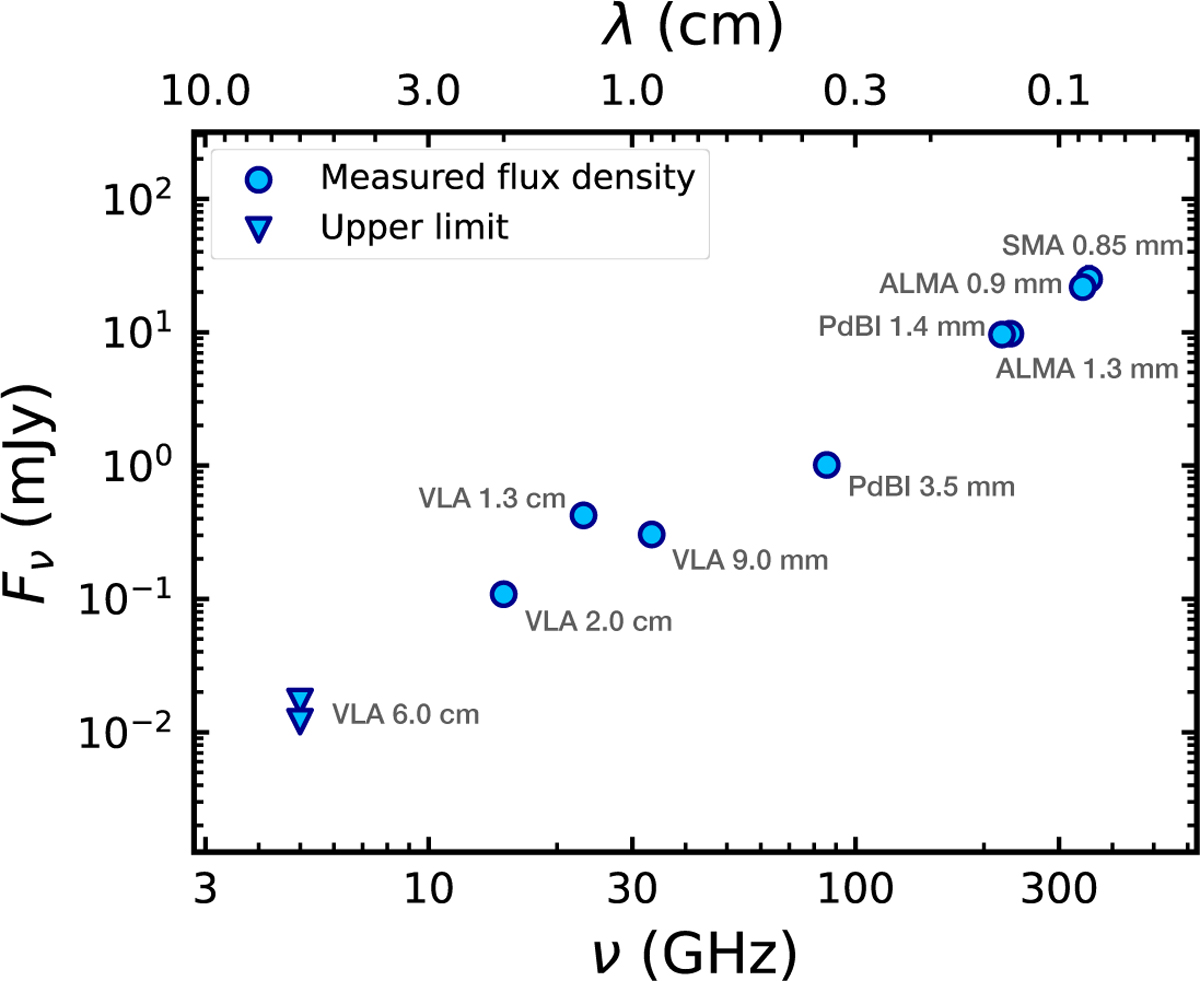
Fig. 2
Download original image
Spectral flux density distribution of CX Tau including data in the submillimeter to centimeter range. For each value of the flux density we report the total uncertainty including the statistical and systematic flux calibration errors. In most cases, the error bars fall within the plotted points. Non-detections are indicated by the upper limits, obtained as the flux from a visibility fit of a central point source plus 2 × RMS.
Current usage metrics show cumulative count of Article Views (full-text article views including HTML views, PDF and ePub downloads, according to the available data) and Abstracts Views on Vision4Press platform.
Data correspond to usage on the plateform after 2015. The current usage metrics is available 48-96 hours after online publication and is updated daily on week days.
Initial download of the metrics may take a while.