Fig. E.2
Download original image
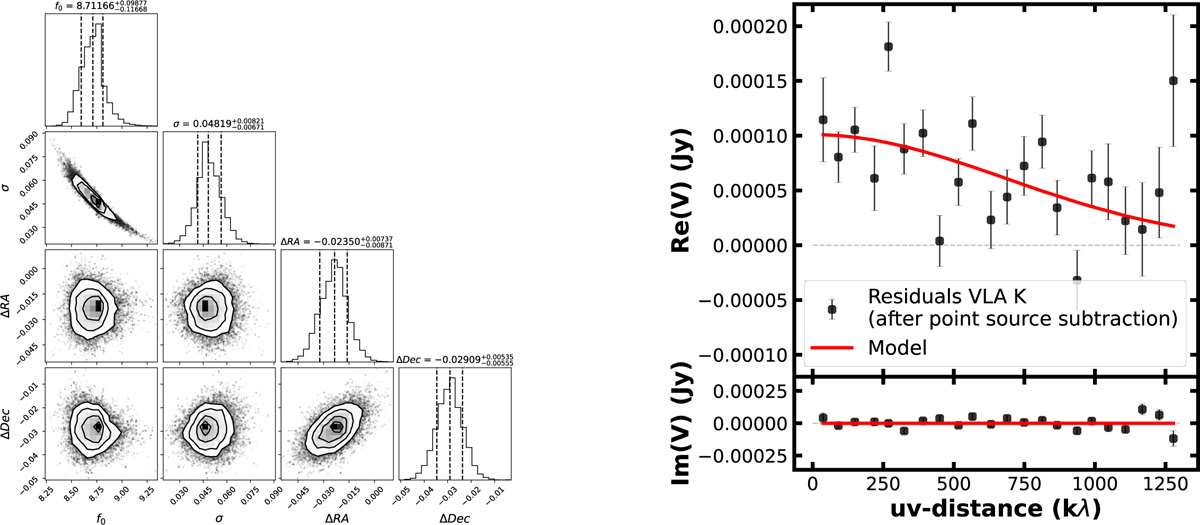
Results of the galario fit with a Gaussian model on VLA K-band (1.3 cm) residual data, after subtracting from the real part of the visibilities their mean values in the range of uv-distance [850, 1300]kλ and neglecting the visibilities over 1300kλ. Left panel: Corner plot of the MCMC run. Right panel: Recentered and deprojected visibilities binned in 60kλ intervals and best-fit model. Error bars are at 1σ.
Current usage metrics show cumulative count of Article Views (full-text article views including HTML views, PDF and ePub downloads, according to the available data) and Abstracts Views on Vision4Press platform.
Data correspond to usage on the plateform after 2015. The current usage metrics is available 48-96 hours after online publication and is updated daily on week days.
Initial download of the metrics may take a while.