Fig. B.1
Download original image
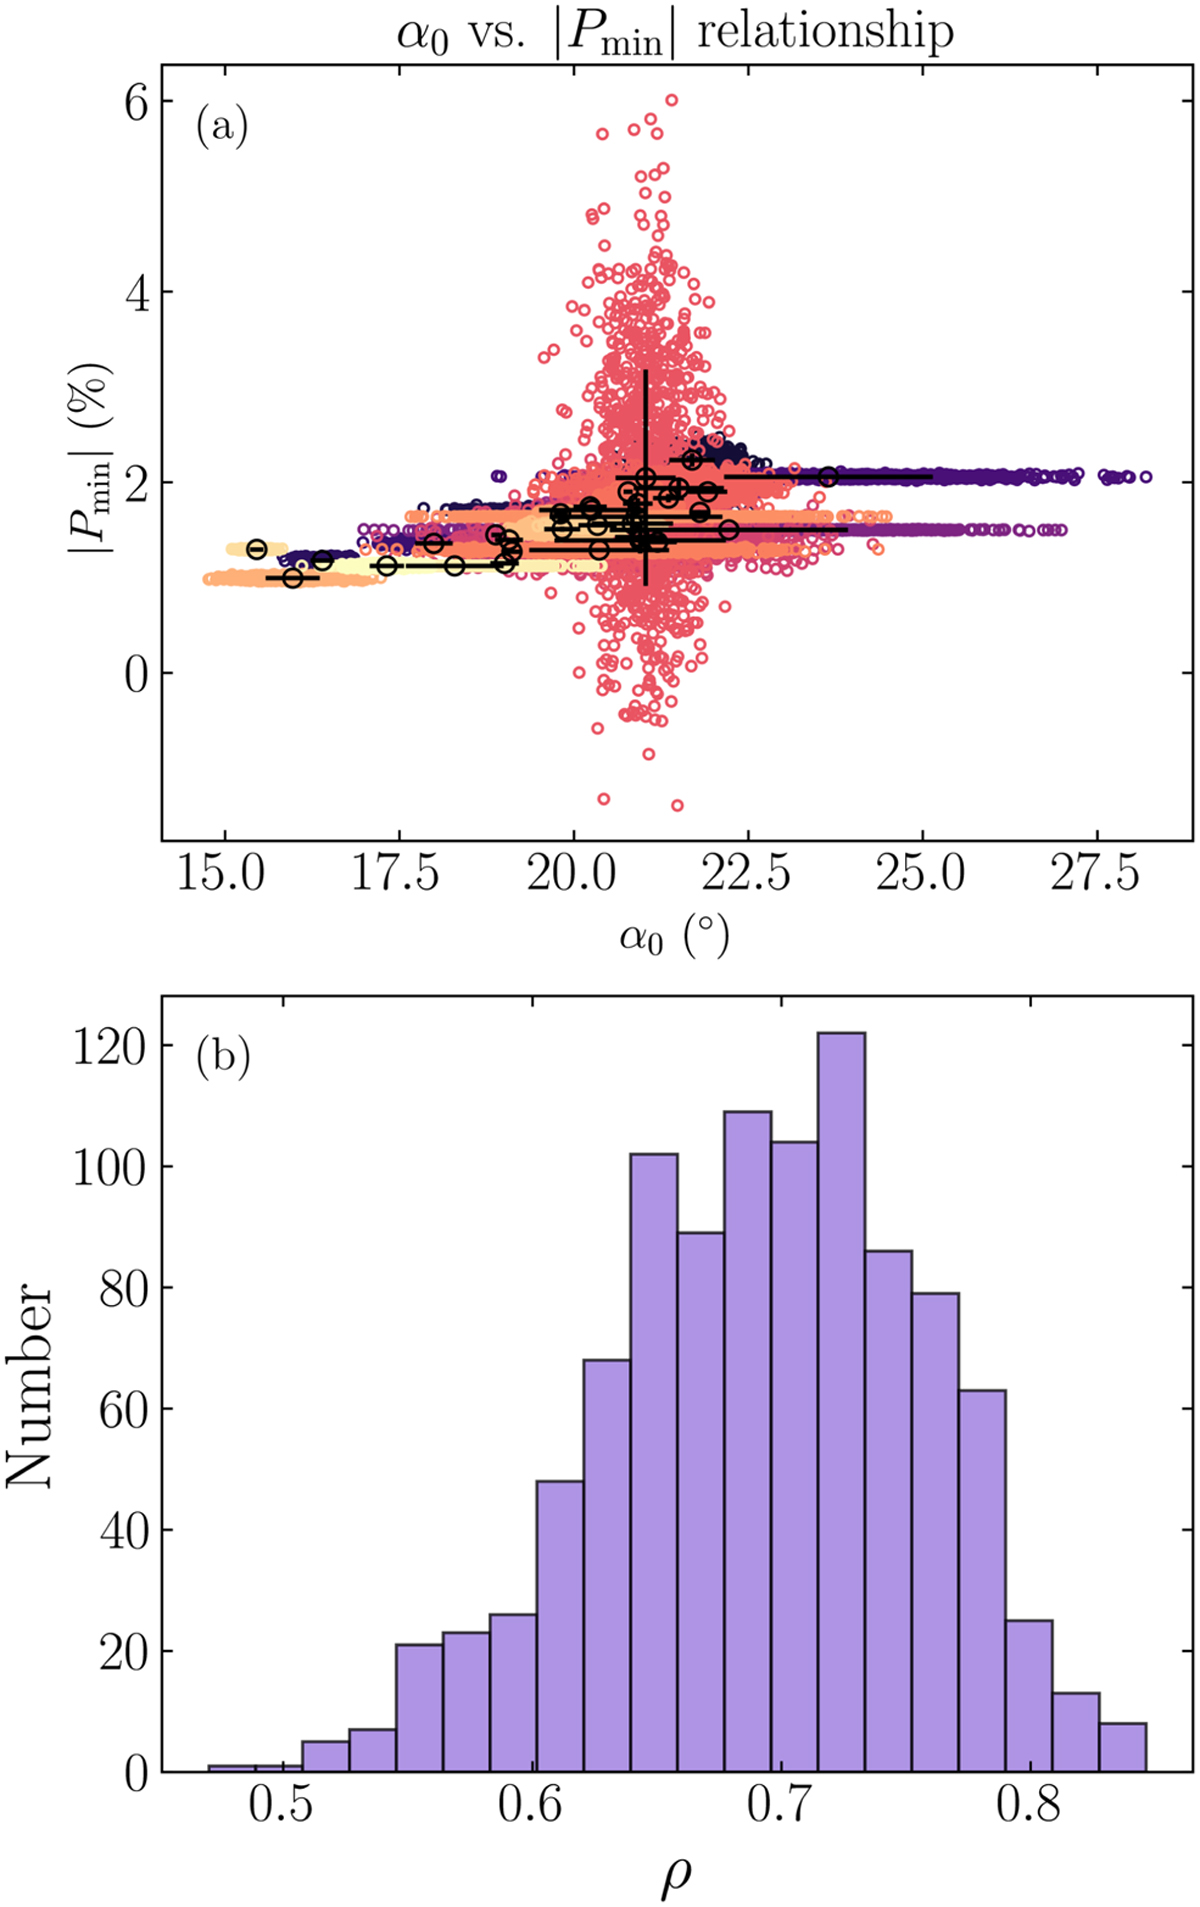
Number distribution of 10,000 clones randomly generated within the range corresponding to the errorbars of the inversion angle α0 and the absolute value of the minimum polarization degree |Pmin|. The retrieved Spearman’s rank correlation coefficient ρ histogram is present in panel b. Colors do not use the same color code used in Figure 5a and are instead assigned at random in the chosen color map.
Current usage metrics show cumulative count of Article Views (full-text article views including HTML views, PDF and ePub downloads, according to the available data) and Abstracts Views on Vision4Press platform.
Data correspond to usage on the plateform after 2015. The current usage metrics is available 48-96 hours after online publication and is updated daily on week days.
Initial download of the metrics may take a while.