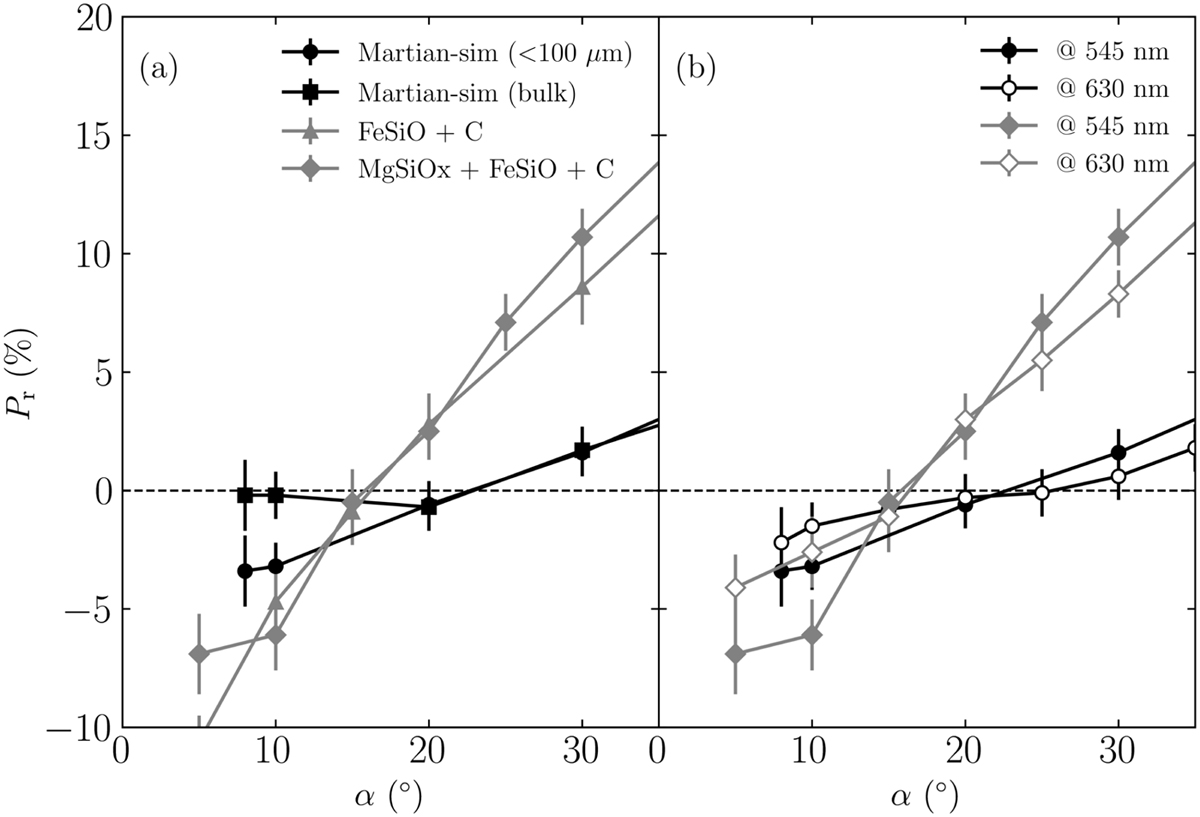
Fig. D.1
Download original image
Polarization-phase curves of martian simulants and mixtures of Mg-Fe silica with carbon from the PROGRA2 experiment database. Sample names in the legend are the same as those in the database. Data in panel a are measurements at 545 nm. Filled symbols in panel b are the same as those in panel a (i.e., the Martian simulant (<100 µm) and Mg·Fe-silica with carbon at 545 nm) but their open counterparts indicate measurements at 630 nm.
Current usage metrics show cumulative count of Article Views (full-text article views including HTML views, PDF and ePub downloads, according to the available data) and Abstracts Views on Vision4Press platform.
Data correspond to usage on the plateform after 2015. The current usage metrics is available 48-96 hours after online publication and is updated daily on week days.
Initial download of the metrics may take a while.