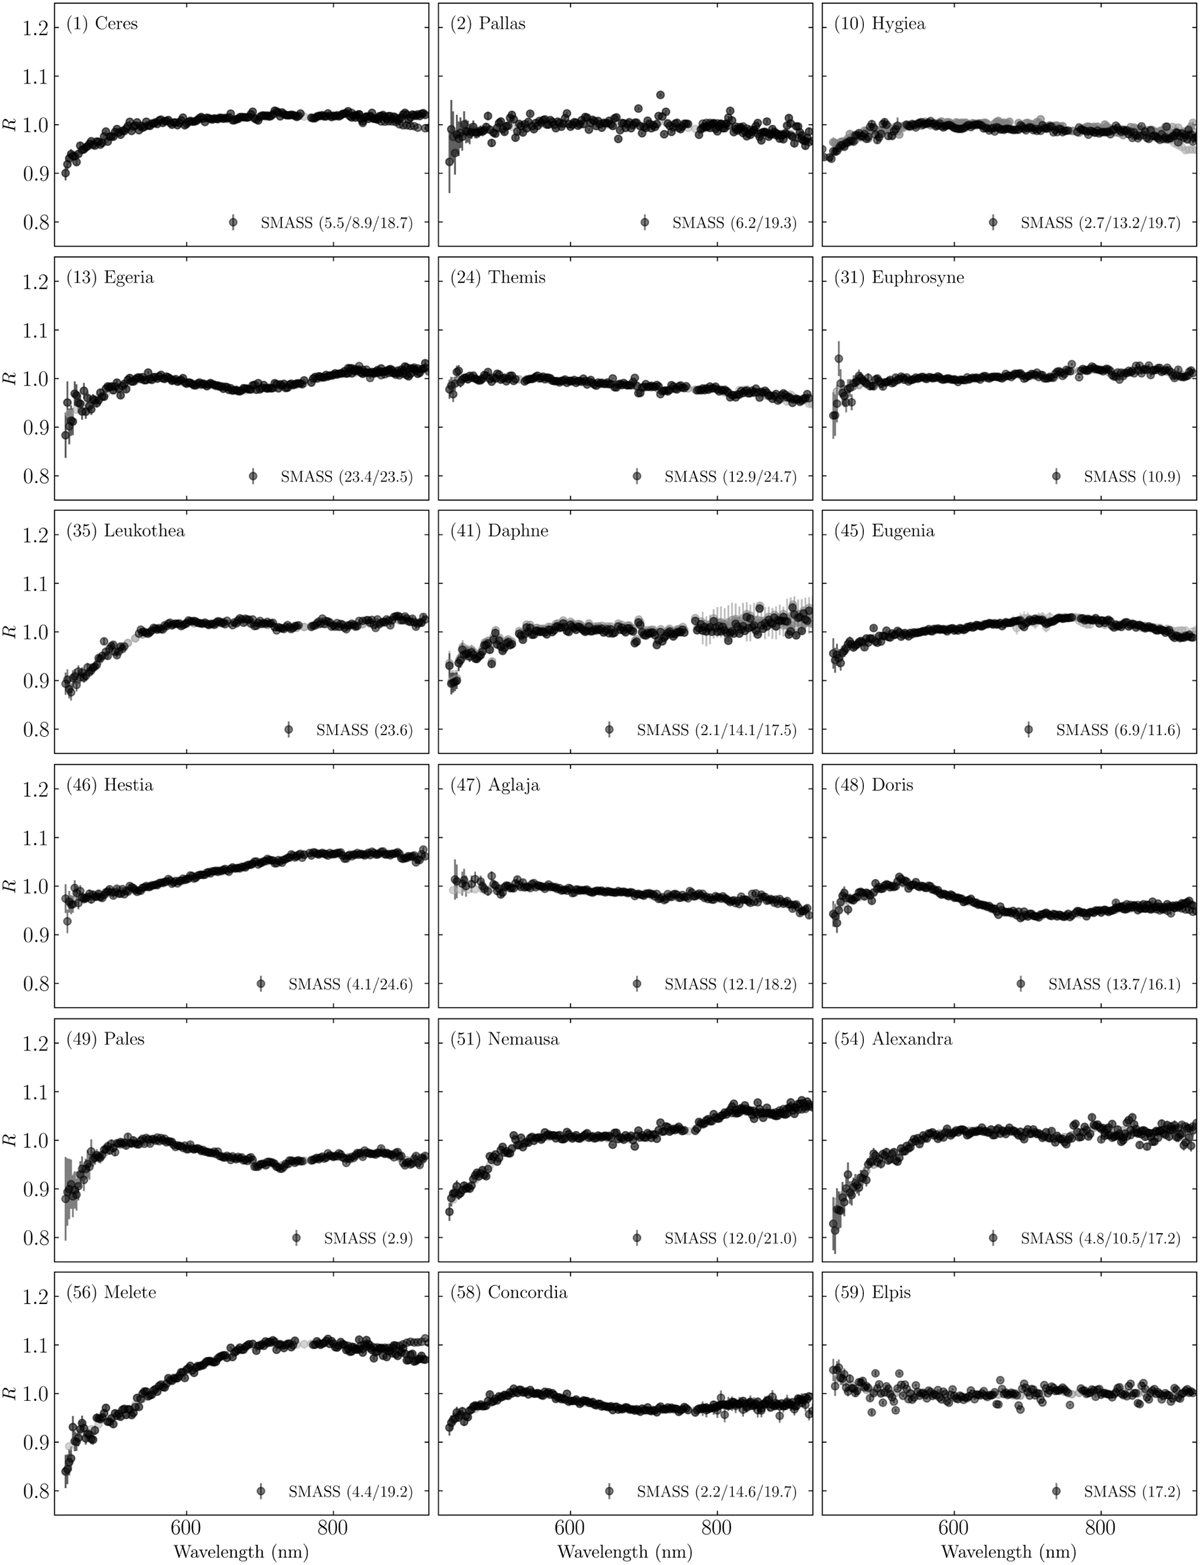
Fig. C.1
Download original image
Reflectance spectra of large, low-albedo C-complex asteroids in Table 2 normalized at 550 nm from SMASSII (Bus & Binzel 2002; DeMeo et al. 2009) and S3OS2 (Lazzaro et al. 2004). Numbers in the parenthesis in each panel indicate phase angles at the time of observations. Weak features near 900 nm appear in the spectra taken at different times with different instruments at edge wavelengths where detectors are less sensitive. Discontinuities shown in several SMASSII spectra near 800 nm are caused by the concatenation of different datasets (DeMeo et al. 2009).
Current usage metrics show cumulative count of Article Views (full-text article views including HTML views, PDF and ePub downloads, according to the available data) and Abstracts Views on Vision4Press platform.
Data correspond to usage on the plateform after 2015. The current usage metrics is available 48-96 hours after online publication and is updated daily on week days.
Initial download of the metrics may take a while.