Fig. 7.
Download original image
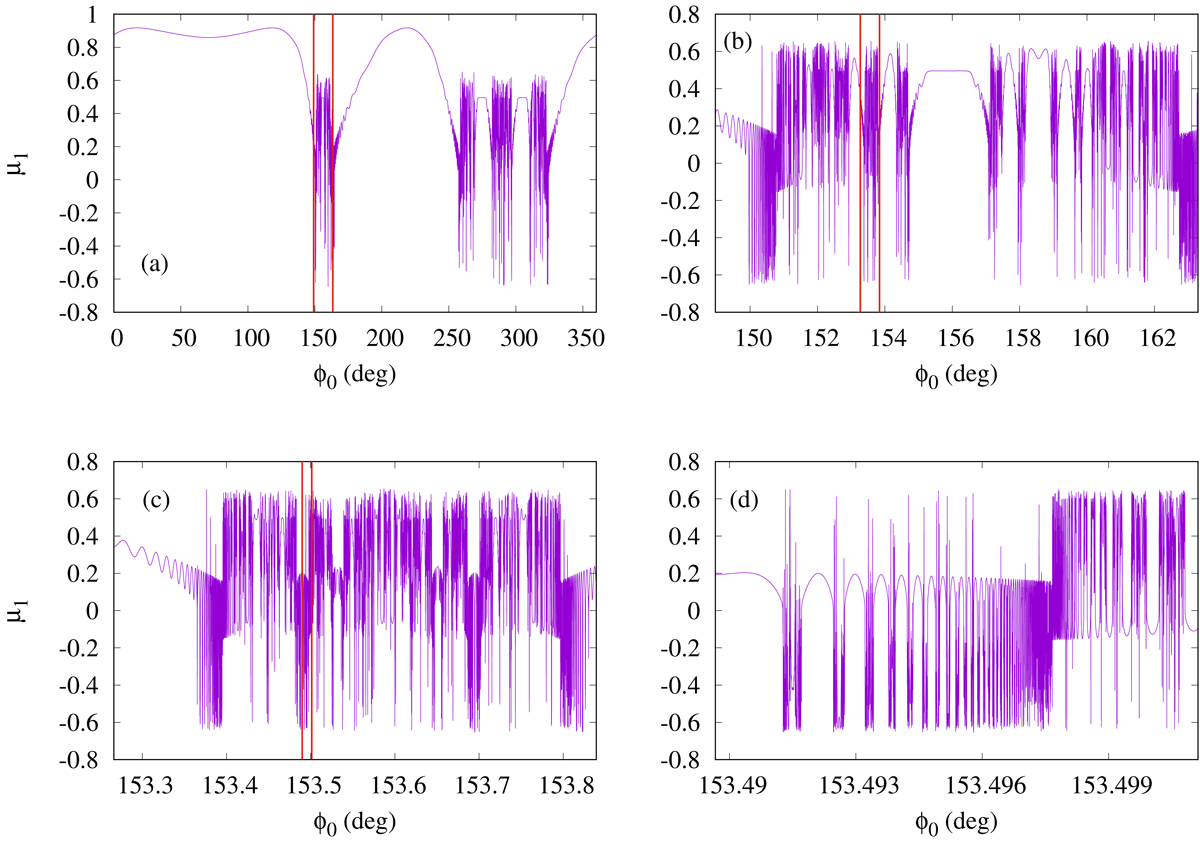
Final pitch-angle cosine μ1 as a function of the initial gyrophase ϕ0 for μ0 = 0.5 in the case β = 90°, α = 60°, and ℰ = 1 MeV (purple curves). Panel a refers to the whole range 0 ≤ ϕ0 ≤ 360°, and panels b–d refer to increasingly small subintervals. Vertical red lines in panels a–c indicate the subinterval represented in the subsequent panel.
Current usage metrics show cumulative count of Article Views (full-text article views including HTML views, PDF and ePub downloads, according to the available data) and Abstracts Views on Vision4Press platform.
Data correspond to usage on the plateform after 2015. The current usage metrics is available 48-96 hours after online publication and is updated daily on week days.
Initial download of the metrics may take a while.