Open Access
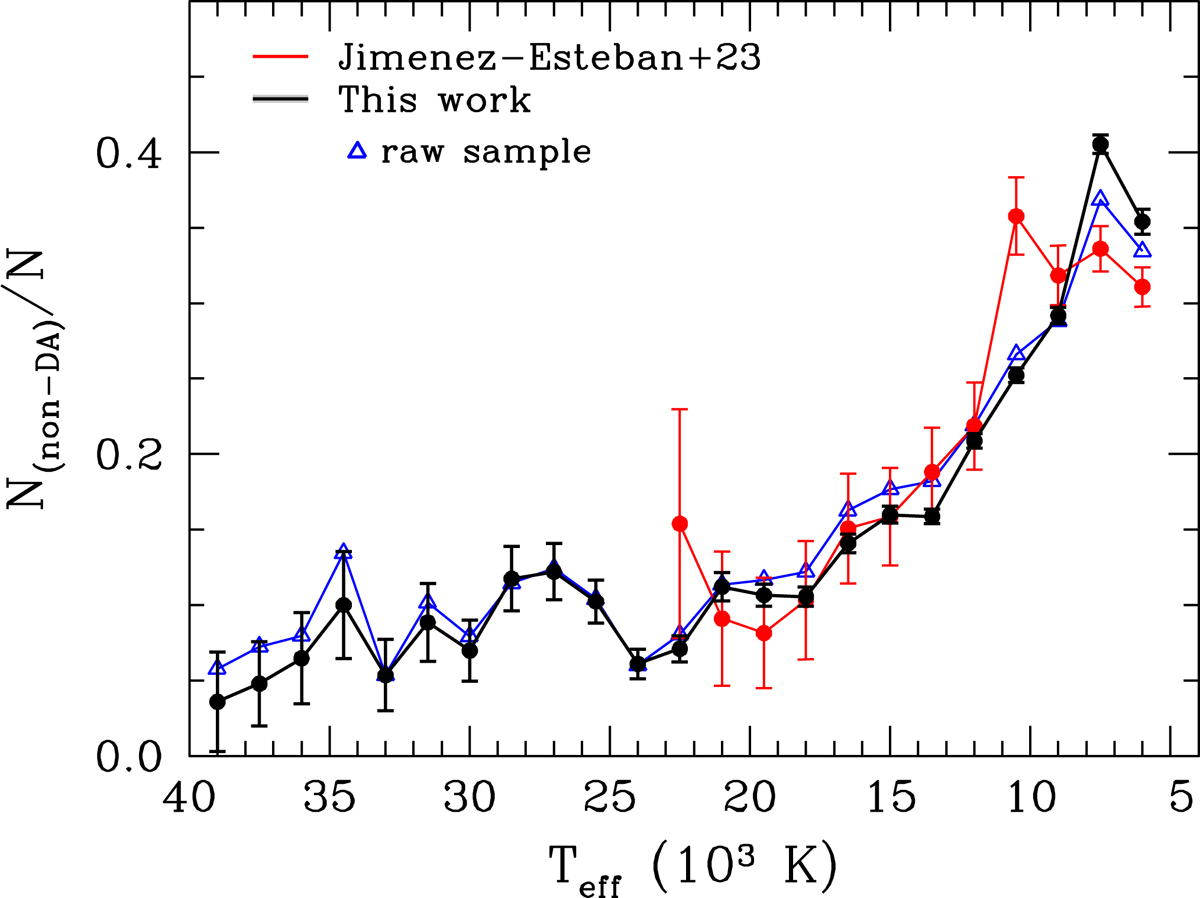
Fig. 6.
Download original image
Spectral distribution presented in this work (black lines and solid circles) and when no selection criteria and correction function is applied at all (blue open triangles). The one obtained for the 100 pc sample (Jiménez-Esteban et al. 2023, red circles) is also shown.
Current usage metrics show cumulative count of Article Views (full-text article views including HTML views, PDF and ePub downloads, according to the available data) and Abstracts Views on Vision4Press platform.
Data correspond to usage on the plateform after 2015. The current usage metrics is available 48-96 hours after online publication and is updated daily on week days.
Initial download of the metrics may take a while.