Fig. 5.
Download original image
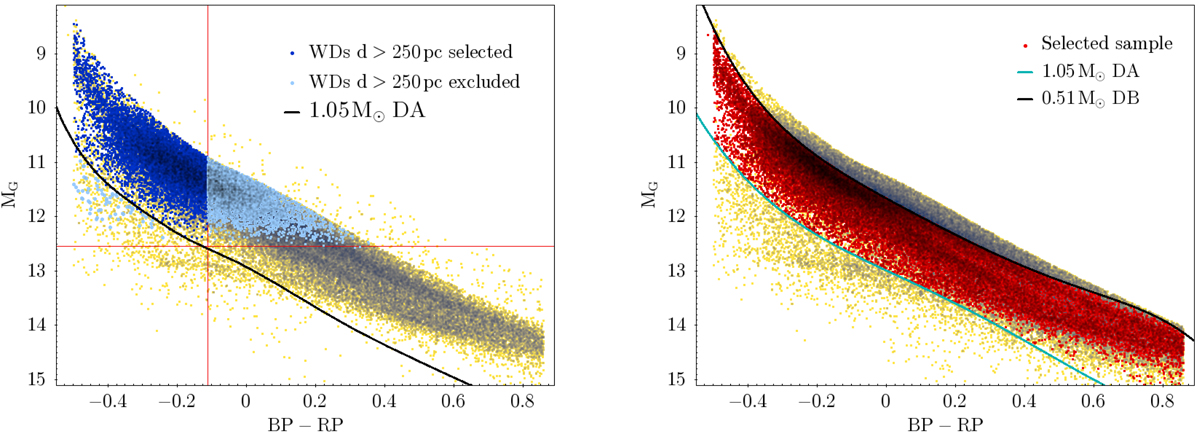
Gaia colour–magnitude diagram of our population of DA and non-DA white dwarfs, shown as yellow dots in the left panel. Highlighted in blue are those objects at distances d > ;250 pc. Assuming a limiting magnitude of Glim = 19.5, only those brighter than MG < 12.5 (horizontal red line) are observable. The cooling track for a 1.05 M⊙ white dwarf (black line) is adopted as our lower selection function limit. For a given distance, only objects (marked in dark blue) at the left of the corresponding colour value (vertical red line) contribute to the final spectral distribution. The white dwarfs selected for building our spectral distribution are highlighted in red in the right panel. Objects above or below the cooling track for a 0.51 M⊙ helium-rich and a 1.05 M⊙ hydrogen-rich white dwarf, respectively, were discarded.
Current usage metrics show cumulative count of Article Views (full-text article views including HTML views, PDF and ePub downloads, according to the available data) and Abstracts Views on Vision4Press platform.
Data correspond to usage on the plateform after 2015. The current usage metrics is available 48-96 hours after online publication and is updated daily on week days.
Initial download of the metrics may take a while.