Fig. 2.
Download original image
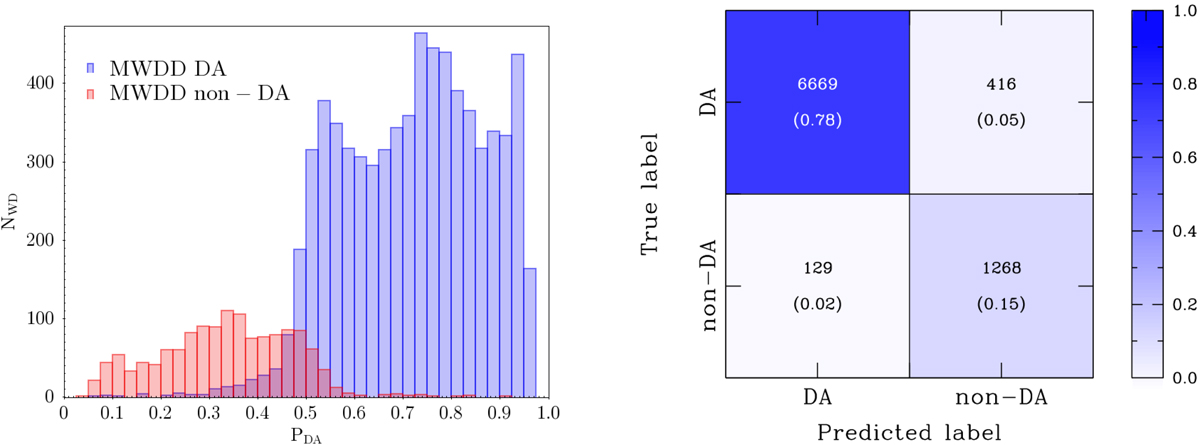
Probability distribution of being DA for the white dwarf labelled as DA or non-DA (blue and red histograms, respectively) in the MWDD (top panel). Confusion matrix of our estimator of being DA (bottom panel). Displayed values represent the total number of objects, while in brackets the percentages with respect to the total population.
Current usage metrics show cumulative count of Article Views (full-text article views including HTML views, PDF and ePub downloads, according to the available data) and Abstracts Views on Vision4Press platform.
Data correspond to usage on the plateform after 2015. The current usage metrics is available 48-96 hours after online publication and is updated daily on week days.
Initial download of the metrics may take a while.