Fig. 1.
Download original image
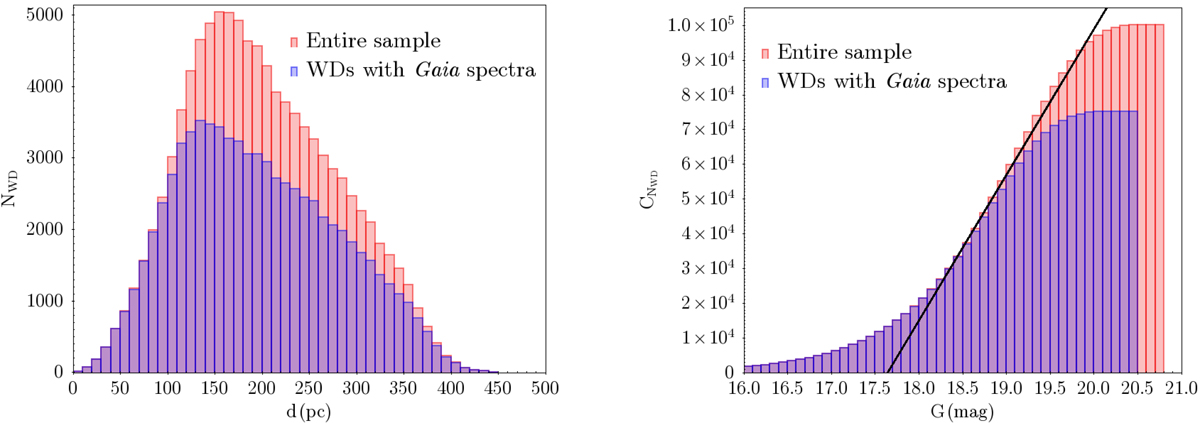
Distance distribution (left panel) and apparent G magnitude cumulative distribution (right panel) for the entire sample of white dwarfs that fulfil our selection criteria (red histogram) and for the subsample of objects that have Gaia spectra (blue histogram). A constant cumulative slope is shown (black line) as indicative of the completeness of the sample.
Current usage metrics show cumulative count of Article Views (full-text article views including HTML views, PDF and ePub downloads, according to the available data) and Abstracts Views on Vision4Press platform.
Data correspond to usage on the plateform after 2015. The current usage metrics is available 48-96 hours after online publication and is updated daily on week days.
Initial download of the metrics may take a while.