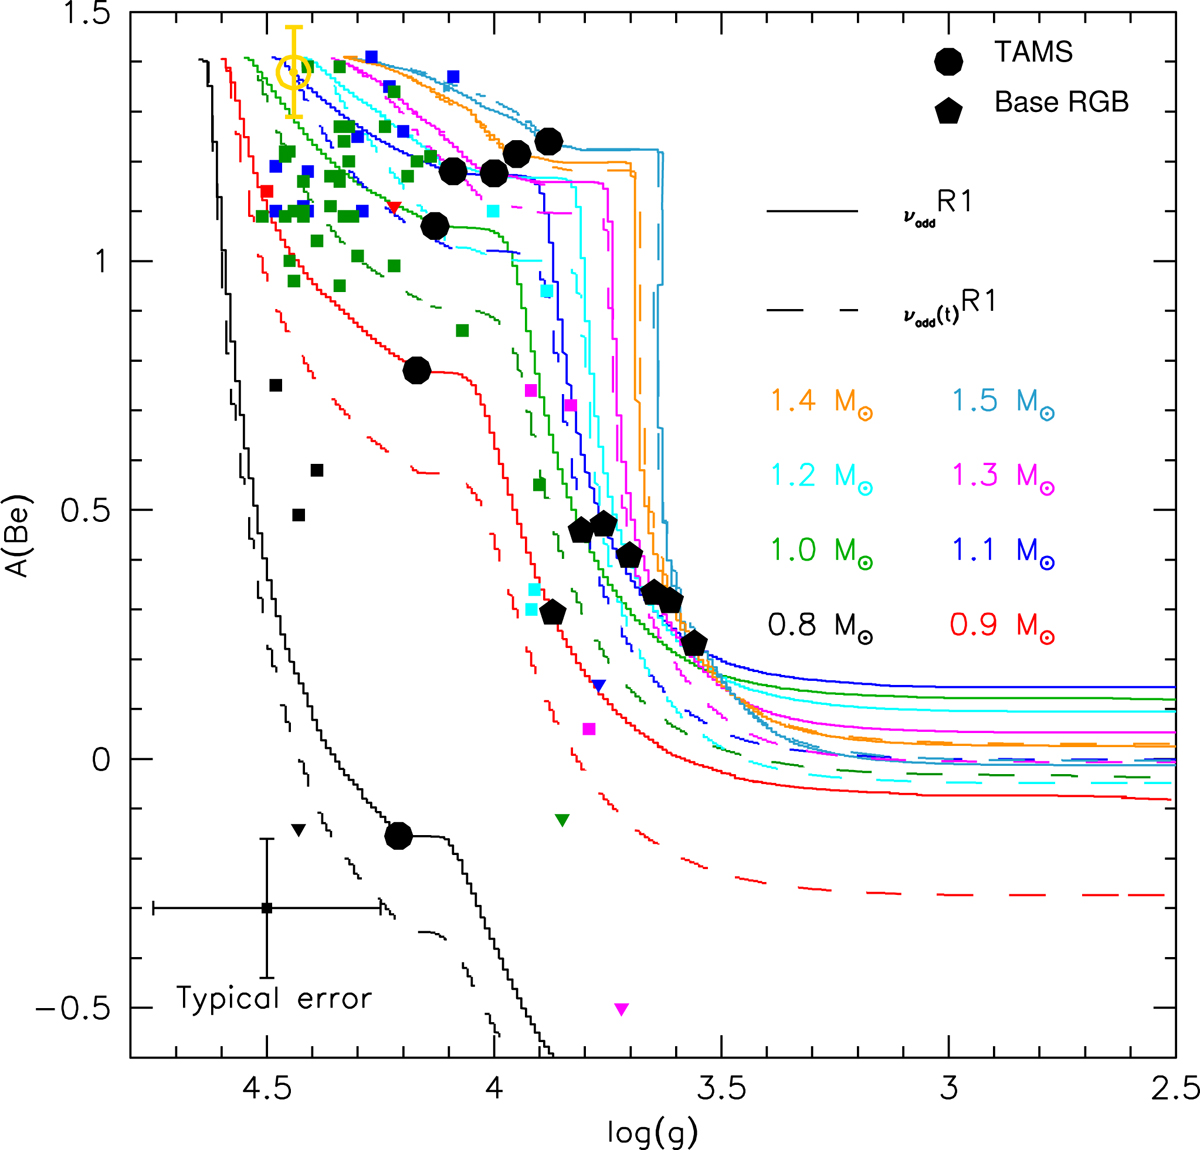
Fig. 9.
Download original image
Evolution of Be surface abundance as function of gravity for 0.8 to 1.5 M⊙ models. Optimal model predictions are in full line, model without additional transport processes are in dashed-line. Observational data are from Santos et al. (2004), Gálvez-Ortiz et al. (2011), Delgado Mena et al. (2012), Boesgaard et al. (2020, 2022a). The Sun is represented in yellow with its usual symbol (Asplund et al. 2021).
Current usage metrics show cumulative count of Article Views (full-text article views including HTML views, PDF and ePub downloads, according to the available data) and Abstracts Views on Vision4Press platform.
Data correspond to usage on the plateform after 2015. The current usage metrics is available 48-96 hours after online publication and is updated daily on week days.
Initial download of the metrics may take a while.