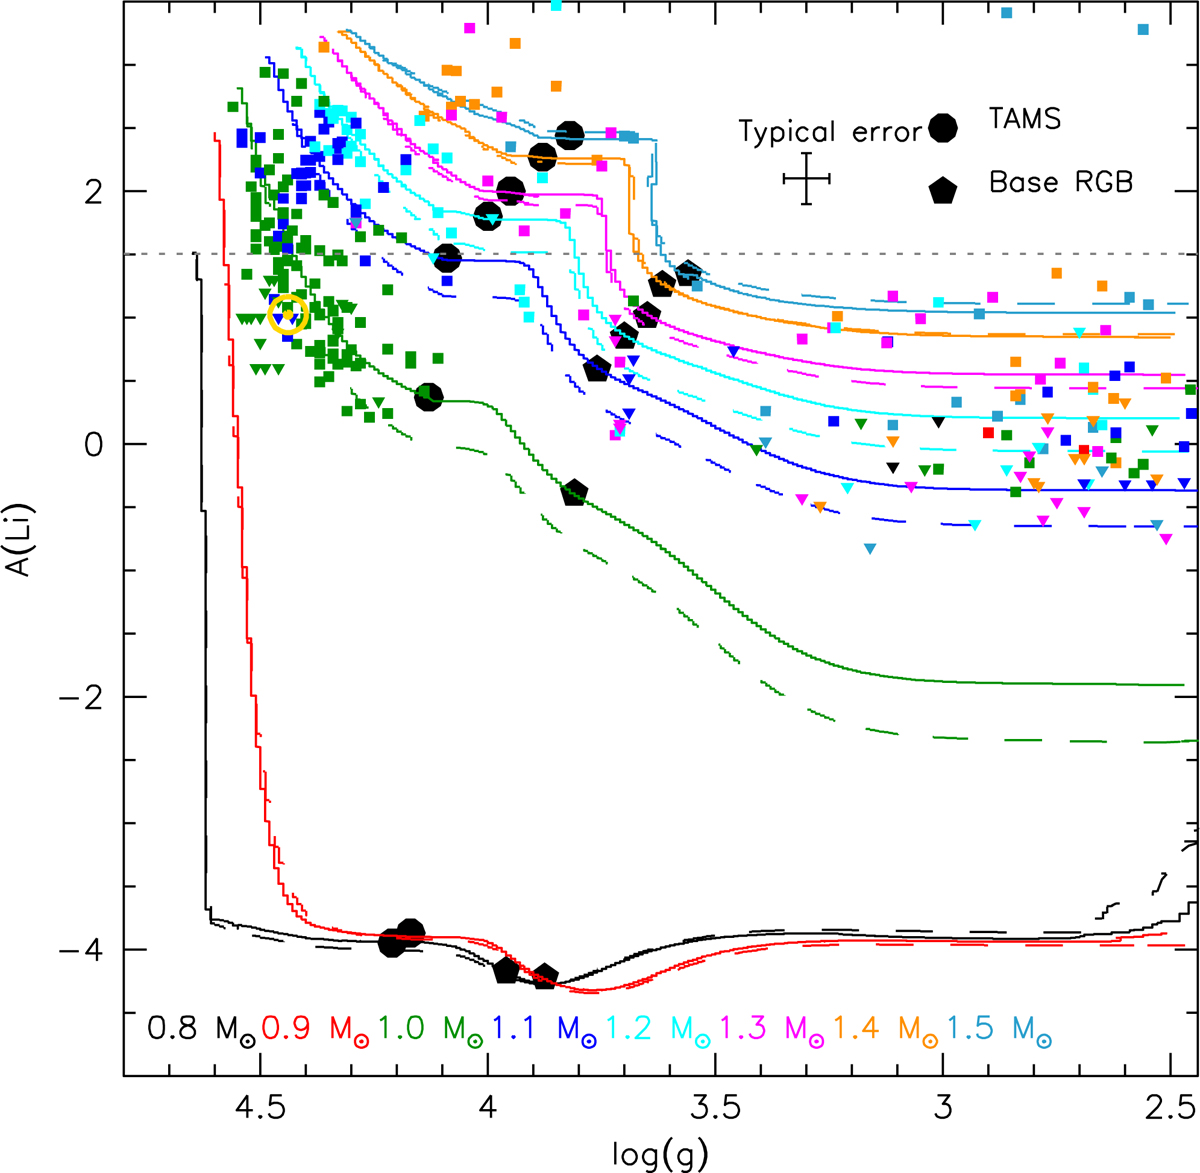
Fig. 8.
Download original image
Evolution of Li surface abundance as a function of surface gravity for the same models as in Fig. 7. The standard Li-rich giant threshold of A(Li) = 1.5 dex is indicated by the grey dashed-line. Observational data are from Luck & Heiter (2007), Pace et al. (2012), Carlos & Meléndez (2020), Semenova et al. (2020), Mallick et al. (2023) and represented by colour-coded squares. The Sun is represented in yellow with its usual symbol (Asplund et al. 2021). TAMS and base of RGB are indicated for νR1 models by black circles and diamonds, respectively.
Current usage metrics show cumulative count of Article Views (full-text article views including HTML views, PDF and ePub downloads, according to the available data) and Abstracts Views on Vision4Press platform.
Data correspond to usage on the plateform after 2015. The current usage metrics is available 48-96 hours after online publication and is updated daily on week days.
Initial download of the metrics may take a while.