Fig. 4.
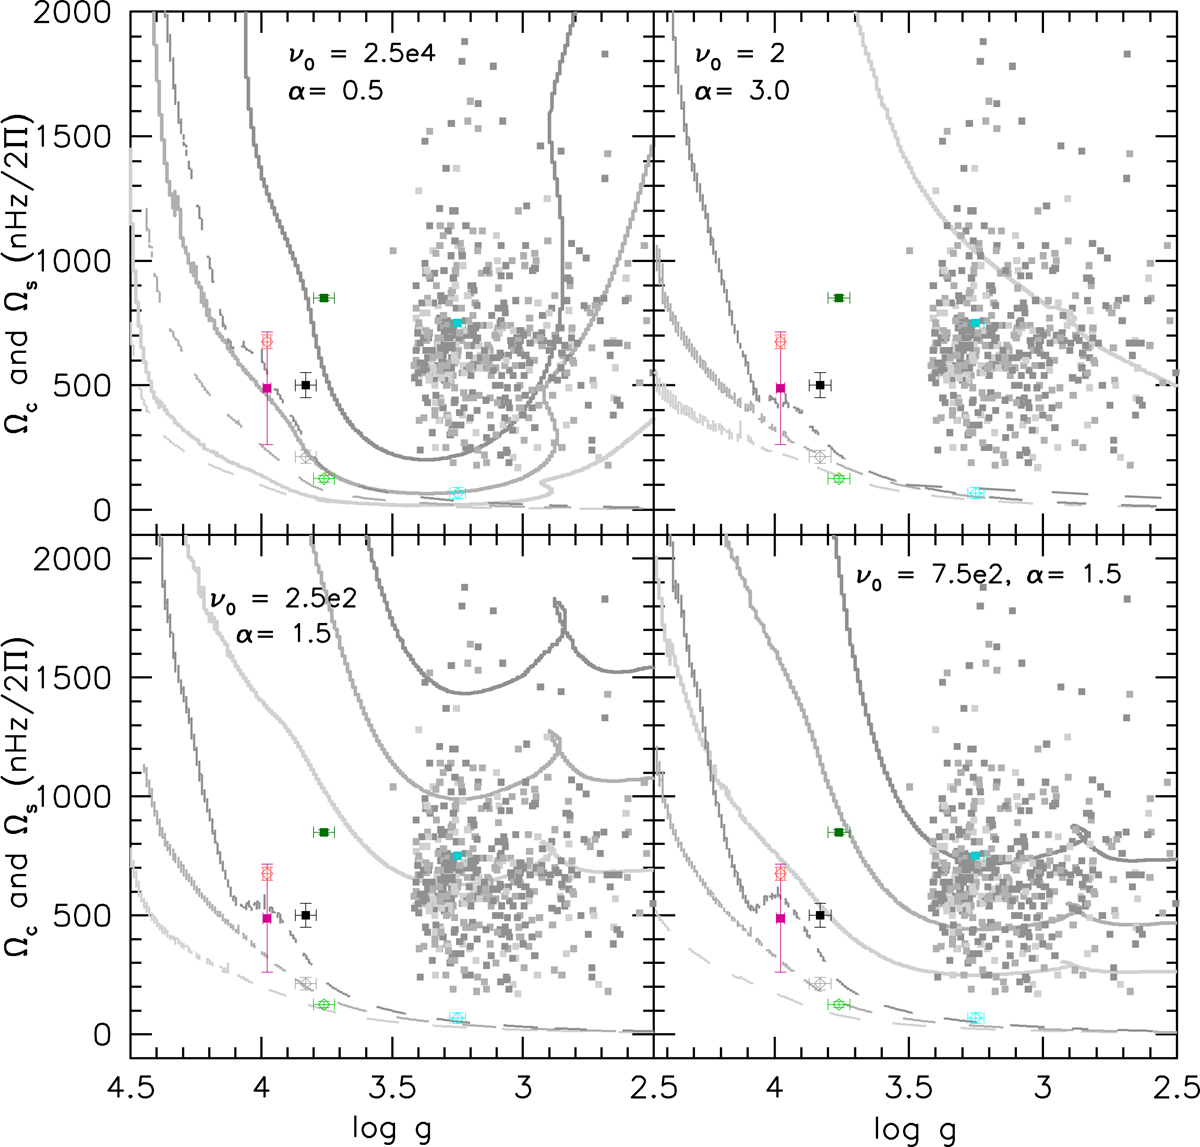
Download original image
Core (full line) and surface (dashed-line) rotation rates for 1.0 (light grey), 1.1 (medium grey), and 1.2 (dark grey) M⊙ models. Different sets of coefficients for the extra-viscosity νadd(t) are explored in each panel: top-left panel: ν0 = 2.5 × 10⁴/α = 0.5, top-right panel: ν0 = 2/α = 3.0, bottom-left panel: ν0 = 2.5 × 10²/α = 1.5, and bottom-right panel: ν0 = 7.5 × 10²/α = 1.5. A, C, and H SGB stars, and KIC 4448777 are indicated with the same colour code as in previous figures. RGB stars from Gehan et al. (2018) are colour-coded as the models predictions according to their determined seismic mass.
Current usage metrics show cumulative count of Article Views (full-text article views including HTML views, PDF and ePub downloads, according to the available data) and Abstracts Views on Vision4Press platform.
Data correspond to usage on the plateform after 2015. The current usage metrics is available 48-96 hours after online publication and is updated daily on week days.
Initial download of the metrics may take a while.