Fig. 2.
Download original image
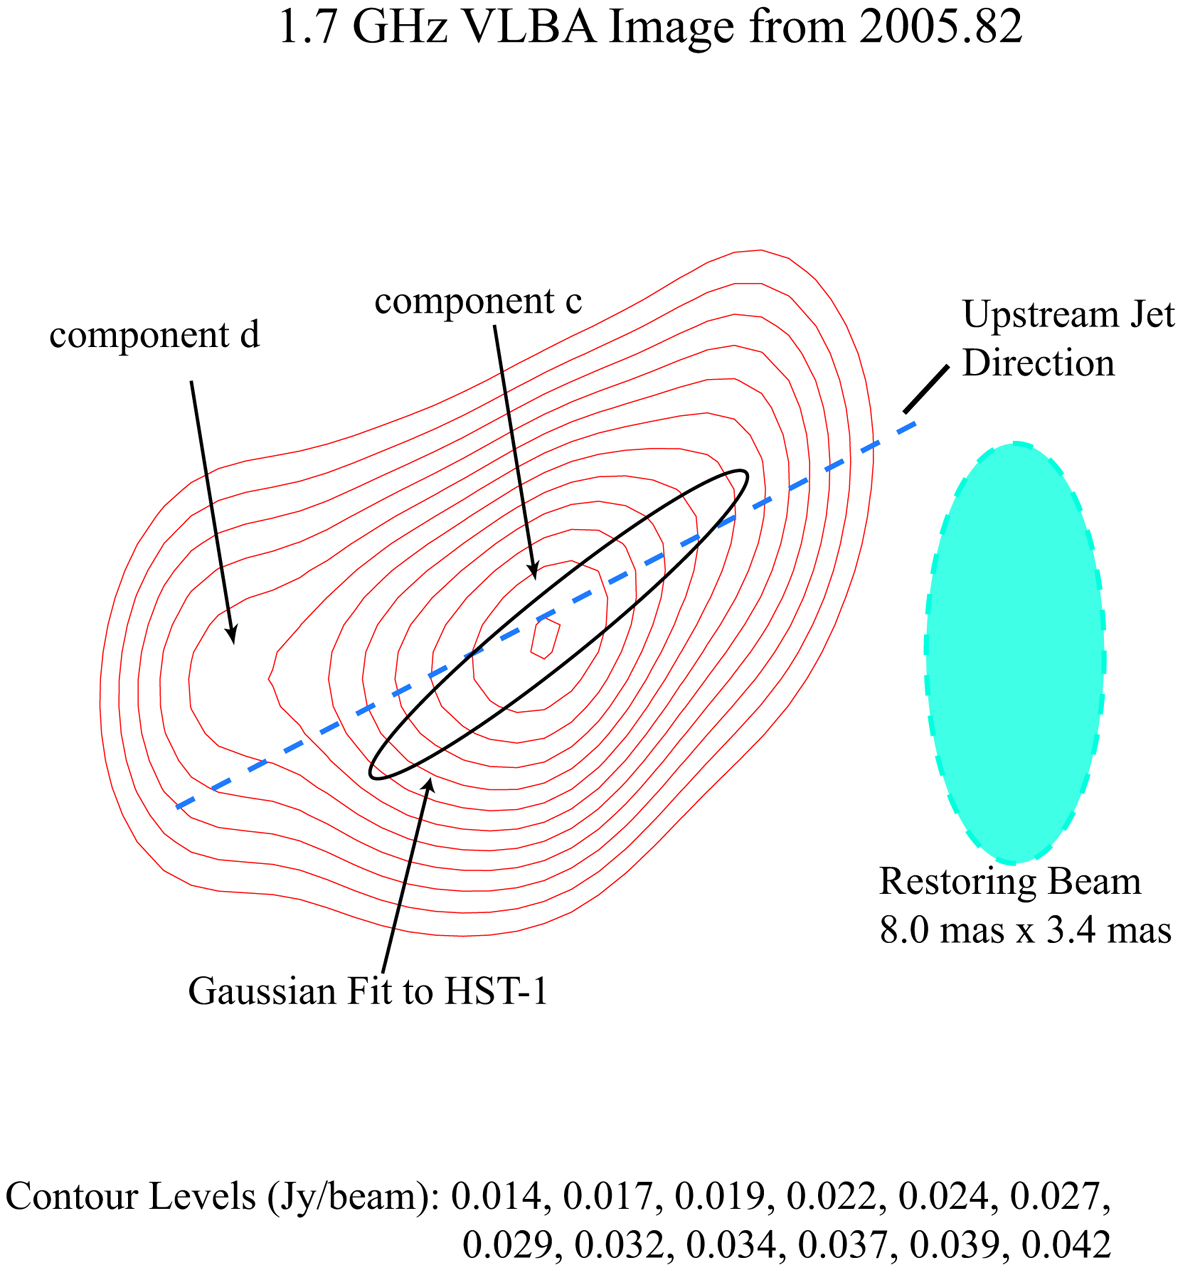
1.7 GHz VLBA image from 2005.82 of HST-1. The Gaussian fit to the component ejected during the 2005 flare, component c, is very elongated along a direction that is close to the local upstream jet direction in Fig. 1. The single Gaussian fit is an ellipse, 9.2 mas × 1.3 mas (unresolved) at PA = −51°. Components a and b are off to the right and are too faint to be revealed by this contour map. The Gaussian beam FWHM in blue provides a scale for the image.
Current usage metrics show cumulative count of Article Views (full-text article views including HTML views, PDF and ePub downloads, according to the available data) and Abstracts Views on Vision4Press platform.
Data correspond to usage on the plateform after 2015. The current usage metrics is available 48-96 hours after online publication and is updated daily on week days.
Initial download of the metrics may take a while.