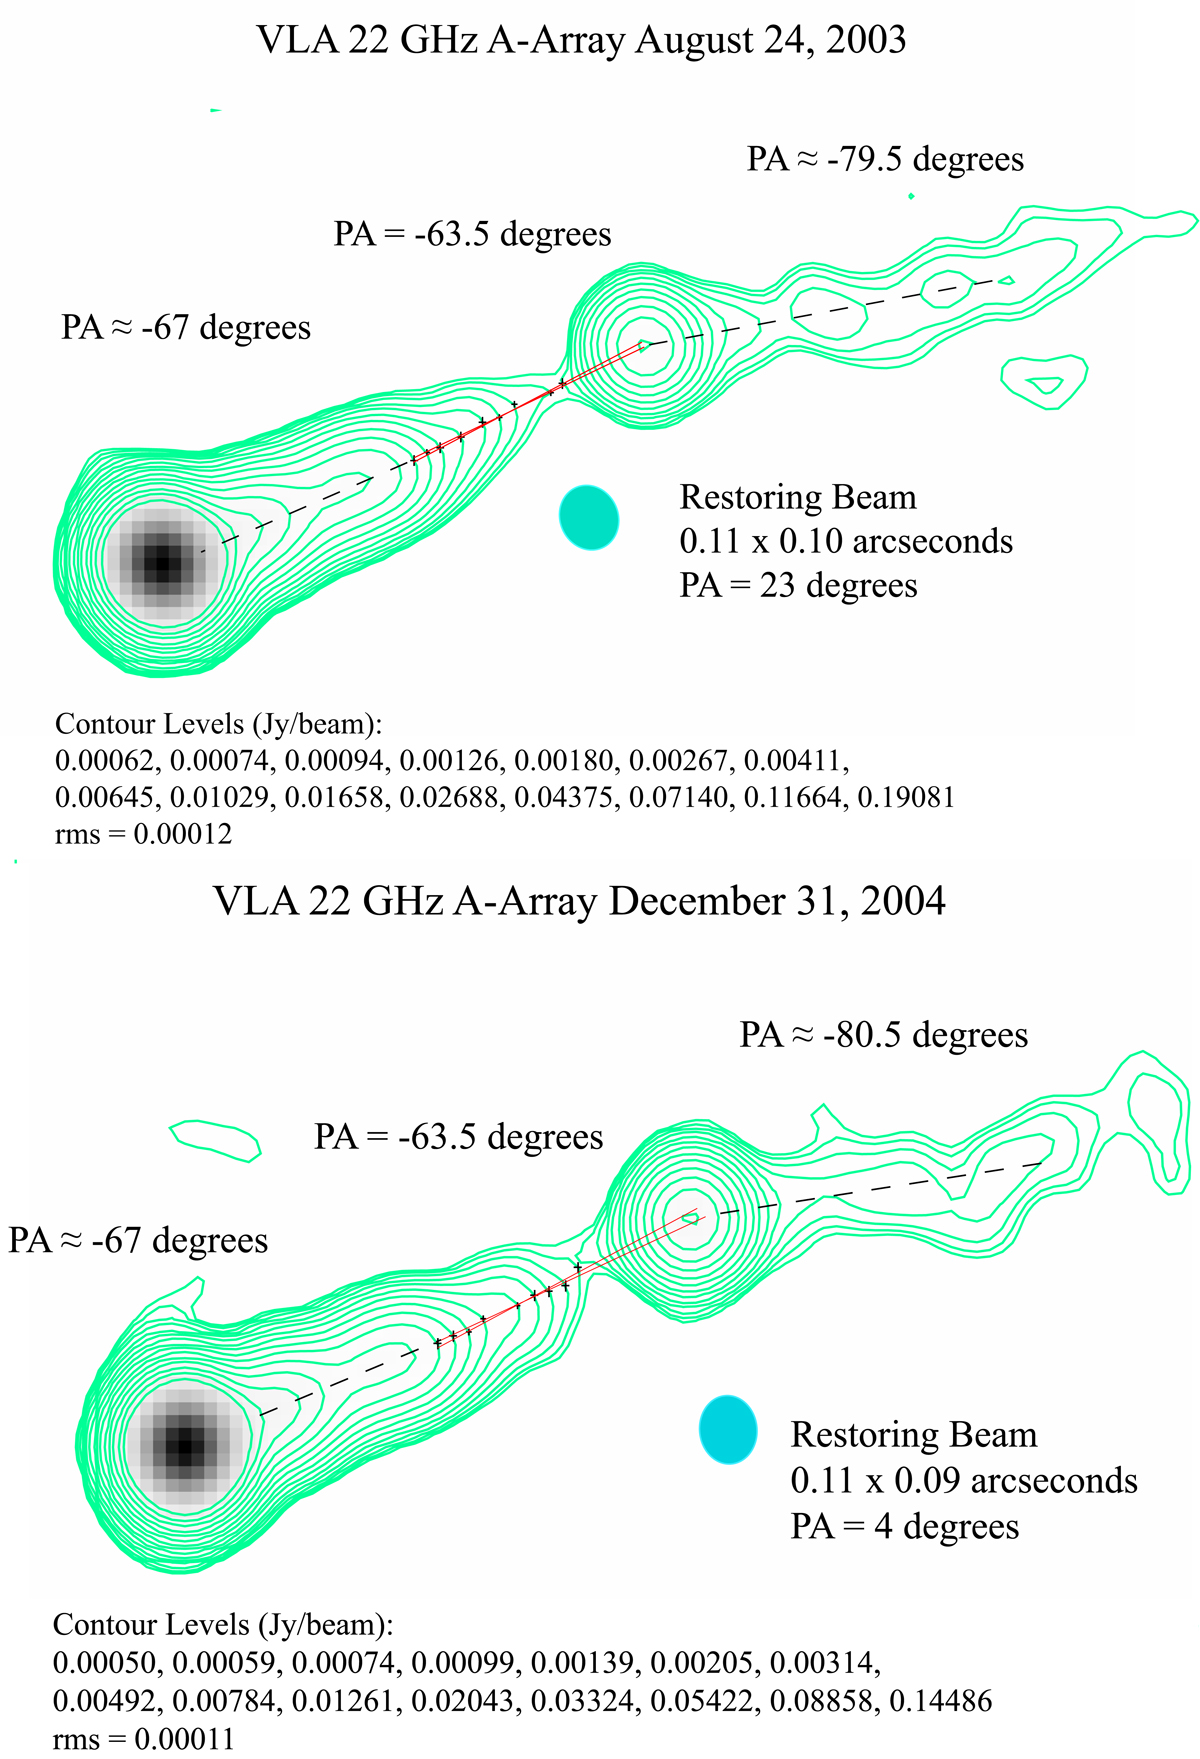
Fig. 1.
Download original image
22 GHz images have the sensitivity to reveal the jet direction in the gap (in 1.7 GHz and 327 MHz VLBA images) between z ≈ 400 mas and HST-1. The red lines in the gap are the range of the standard error in the linear fit to the peak intensity (identified with the jet center-line). HST-1 lies on a short extrapolation of the jet center-line to within ±6 mas. The image from December 31, 2004 is at the beginning of the flare. The Gaussian beam FWHM in blue provides a scale for the image.
Current usage metrics show cumulative count of Article Views (full-text article views including HTML views, PDF and ePub downloads, according to the available data) and Abstracts Views on Vision4Press platform.
Data correspond to usage on the plateform after 2015. The current usage metrics is available 48-96 hours after online publication and is updated daily on week days.
Initial download of the metrics may take a while.