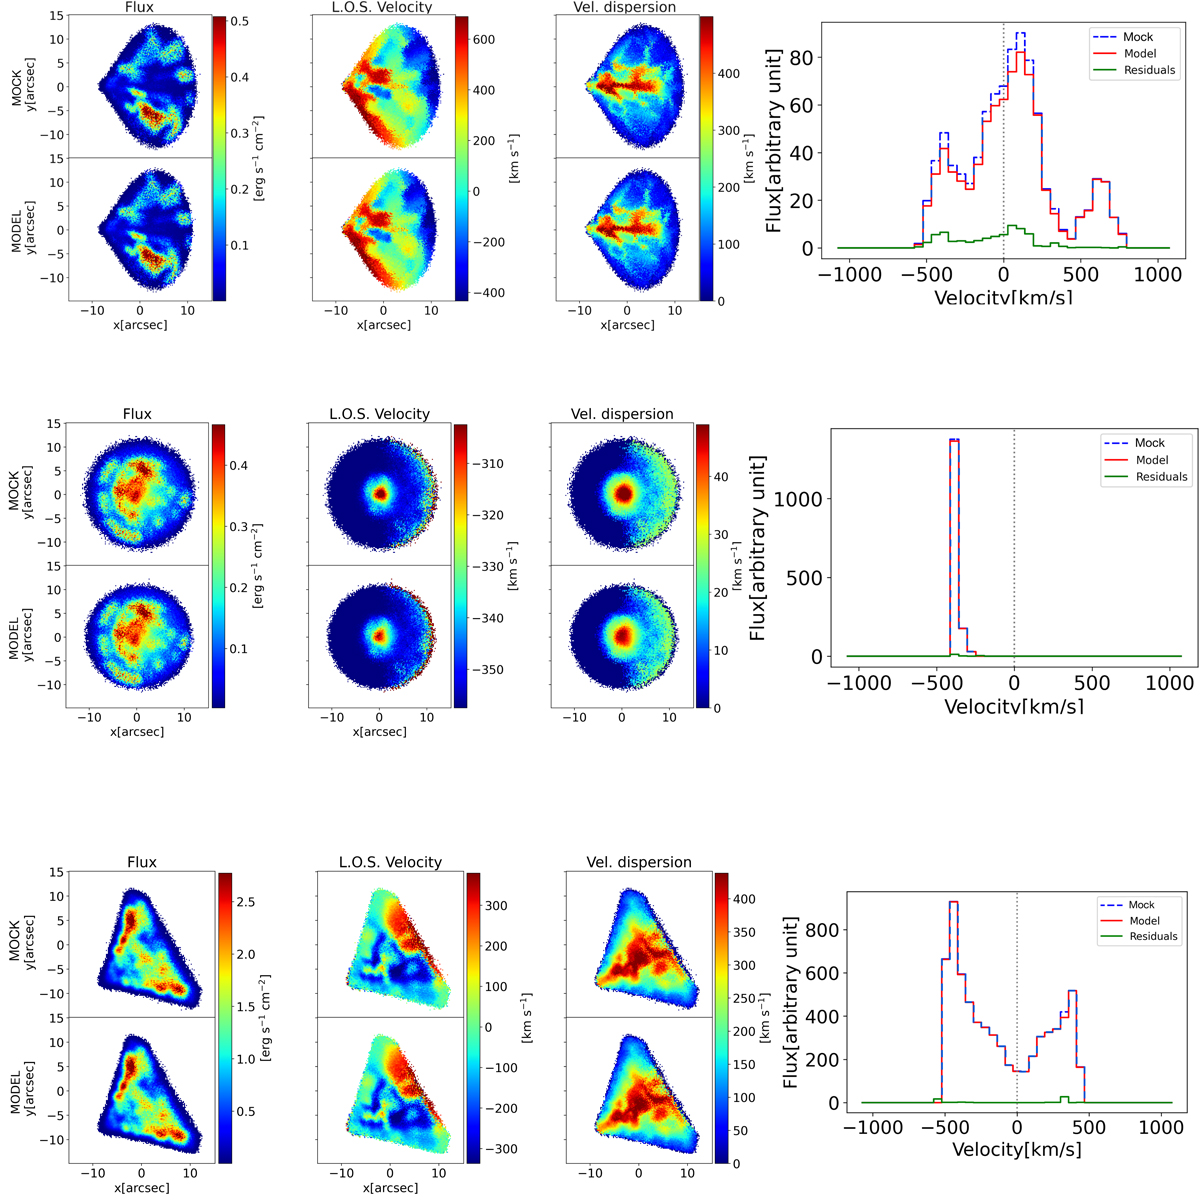
Fig. 8.
Download original image
Moment maps and integrated emission comparison between three simulated and best-fit models. From top to bottom: Model 1, Model 2, and Model 3, whose parameters are listed in Table 2. Left panel: comparison of simulated and best-fit moment maps. From left to right: integrated emission, LOS velocity, and velocity dispersion maps. Right panel: comparison of simulated data (dotted blue) and best-fit integrated profile (red). Residual emission is shown in green.
Current usage metrics show cumulative count of Article Views (full-text article views including HTML views, PDF and ePub downloads, according to the available data) and Abstracts Views on Vision4Press platform.
Data correspond to usage on the plateform after 2015. The current usage metrics is available 48-96 hours after online publication and is updated daily on week days.
Initial download of the metrics may take a while.