Open Access
Fig. 5
Download original image
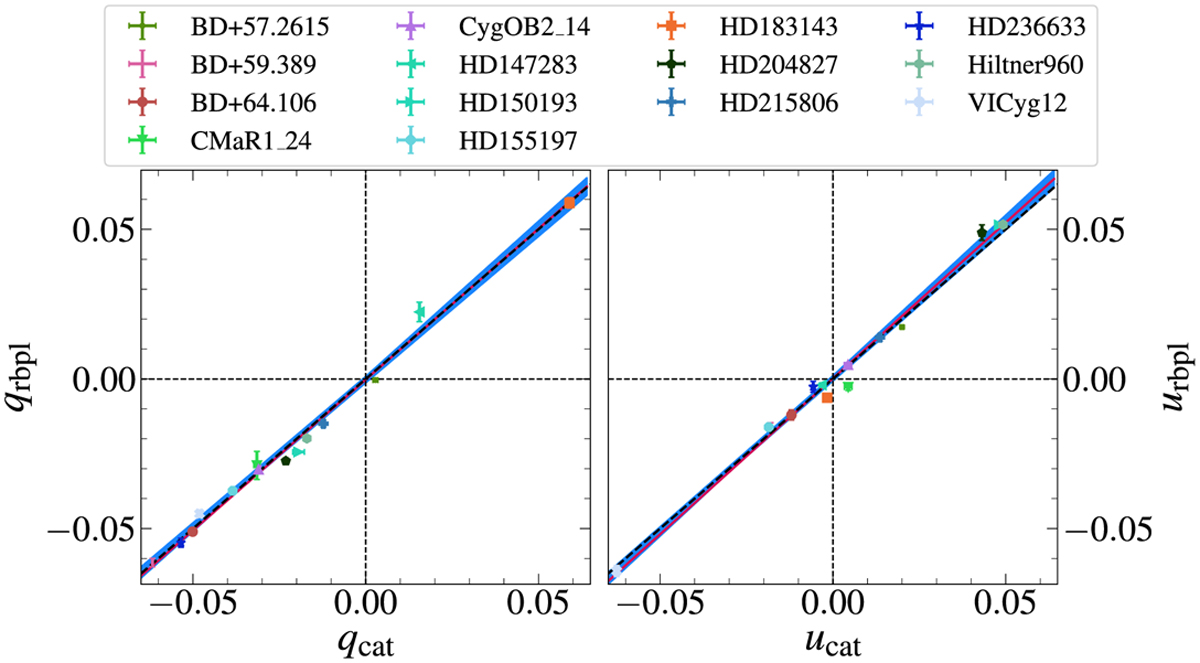
Weighted mean values of Stokes parameters of high-polarization standards, as measured by RoboPol vs. catalog values from Table 1. The black dashed line is y = x; the red solid line is the ordinary least-squares regression fit to the data. The light blue region is the 1σ uncertainty region of the fit.
Current usage metrics show cumulative count of Article Views (full-text article views including HTML views, PDF and ePub downloads, according to the available data) and Abstracts Views on Vision4Press platform.
Data correspond to usage on the plateform after 2015. The current usage metrics is available 48-96 hours after online publication and is updated daily on week days.
Initial download of the metrics may take a while.