Fig. 8.
Download original image
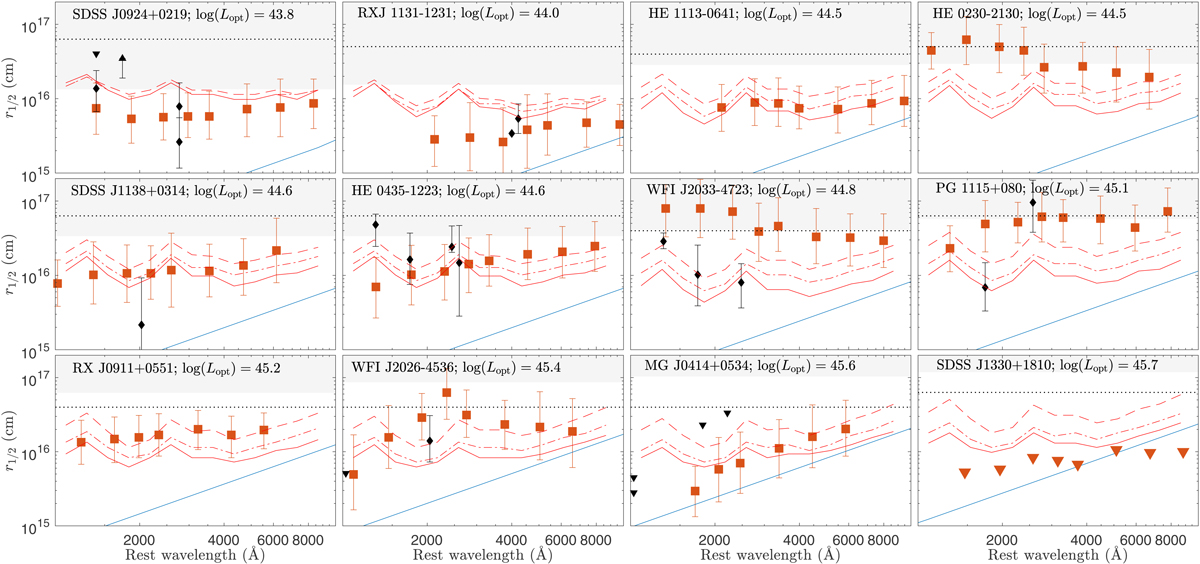
Microlensing-based size estimates versus theoretical predictions for 12 strongly lensed quasars. The expected half-light radius for an SS73 disk for each source is shown as a blue line. The red curves show model predictions that include all relevant bound-bound, bound-free, and free-free emission processes and are convolved with a typical broadband throughput kernel to mimic broadband data. Three models are shown: a RPC model (Baskin et al. 2014) that accounts for the Baldwin relation (solid line), a similar model but with the addition of an inner BLR funnel (Chelouche et al. 2019; dotted-dashed curve), and a similar model to the latter but ignoring the effect of the Baldwin relation and setting the BLR properties to those given in Table 1, which characterize low-luminosity sources (dashed curve). Tiles are sorted by increasing object luminosity from left to right and from top to bottom. Microlensing data are shown with respective error bars (68% confidence intervals) as red squares (Blackburne et al. 2011) and as black points (see Table 2). Upper and lower limits are denoted by downward and upward pointing triangles, respectively. The Einstein radius for each lens is denoted by the horizontal black dotted line. Shaded regions mark the scale range subtended by the BLR (rout exceeds the axis limits in all cases).
Current usage metrics show cumulative count of Article Views (full-text article views including HTML views, PDF and ePub downloads, according to the available data) and Abstracts Views on Vision4Press platform.
Data correspond to usage on the plateform after 2015. The current usage metrics is available 48-96 hours after online publication and is updated daily on week days.
Initial download of the metrics may take a while.