Fig. 2.
Download original image
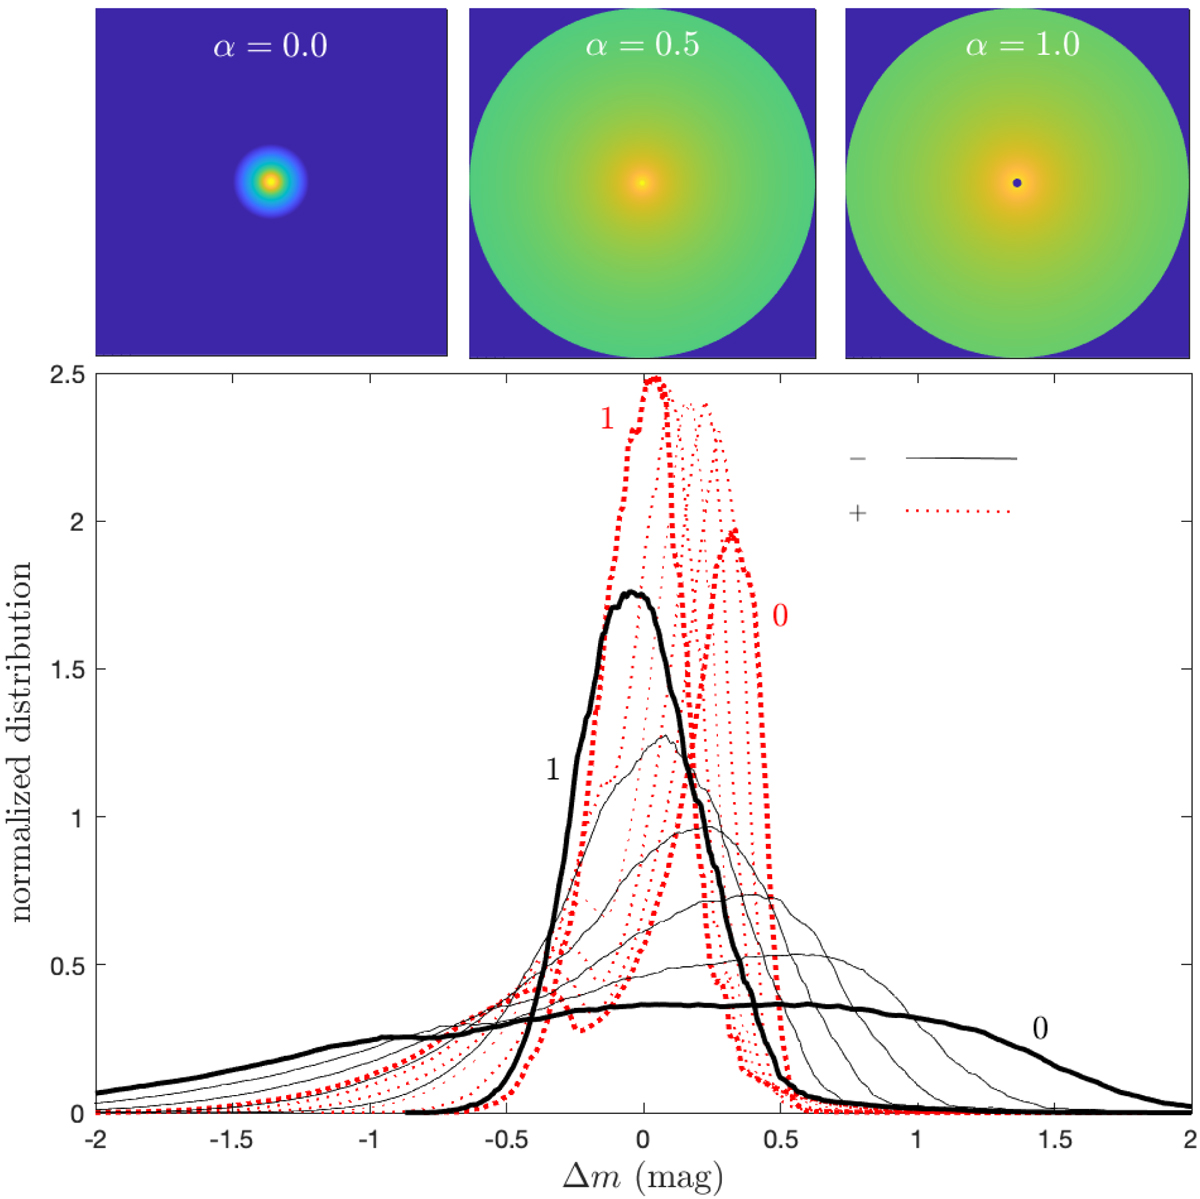
Magnification distributions (relative to the mean magnification of the image) for several assumptions regarding the contribution of a diffuse emission component to the flux in some band, which is parameterized by α (see the main text). Bold distribution curves mark α = 0.0 and α = 1.0 cases for each image parity (see the legend), with the thin curves separated by Δα = 0.2 intervals. The top panels show the emissivity profiles in log-units for three models, with their α-values denoted. Color-coding is arbitrarily but identically normalized in all panels. Note the reduced second moment of the magnification distribution function with increasing α.
Current usage metrics show cumulative count of Article Views (full-text article views including HTML views, PDF and ePub downloads, according to the available data) and Abstracts Views on Vision4Press platform.
Data correspond to usage on the plateform after 2015. The current usage metrics is available 48-96 hours after online publication and is updated daily on week days.
Initial download of the metrics may take a while.