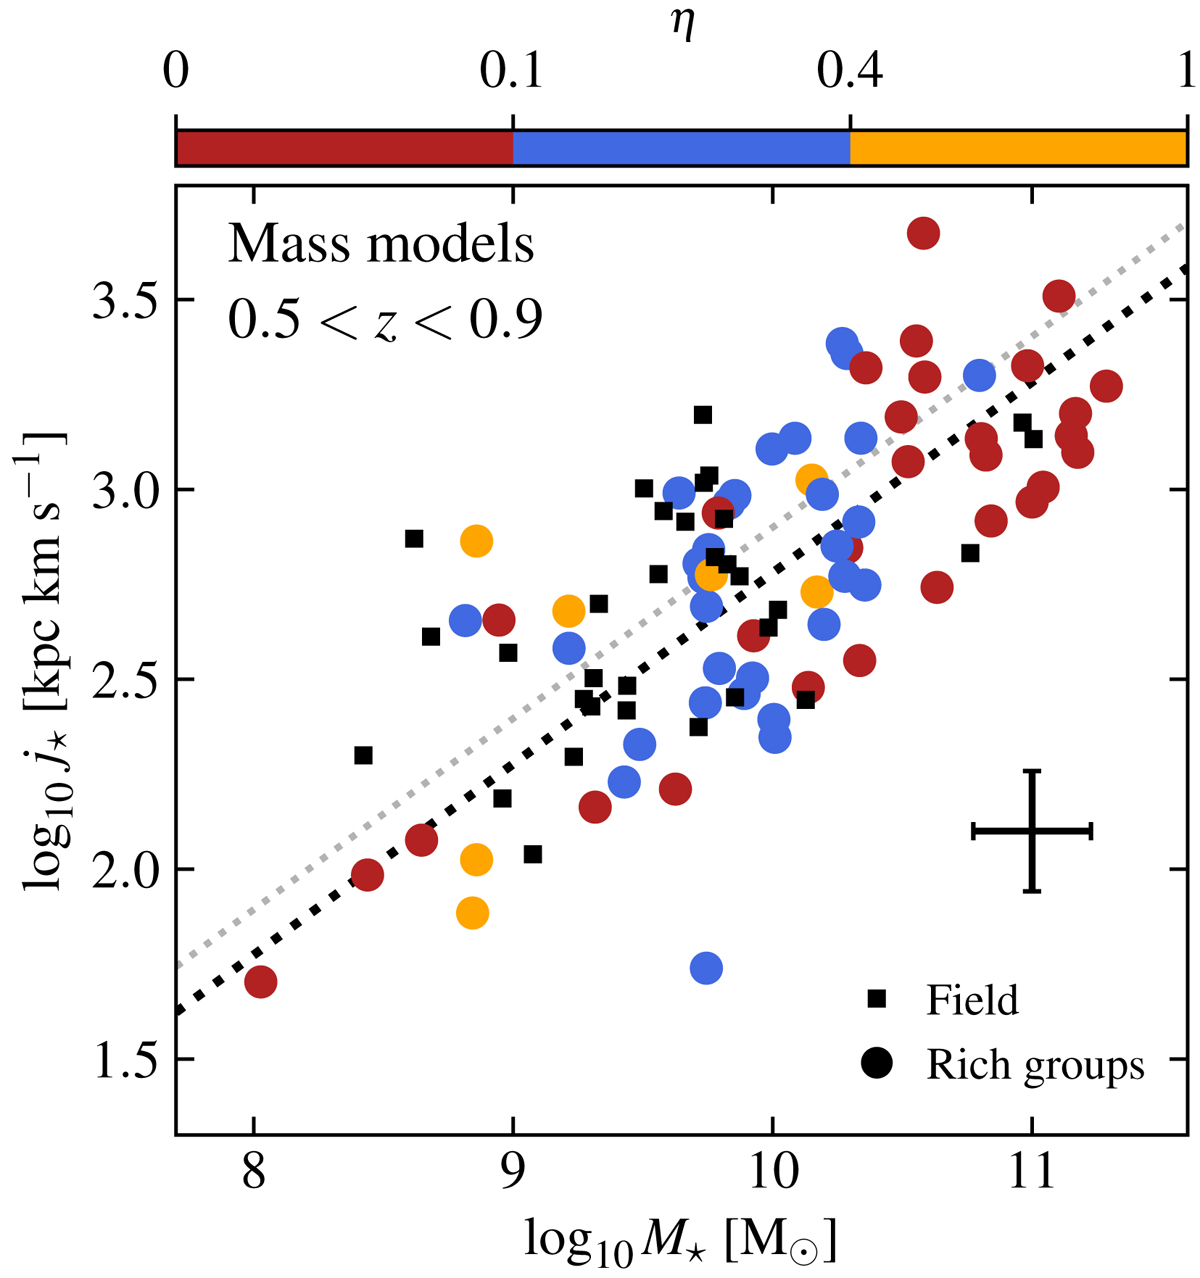
Fig. 5.
Download original image
Fall relation colour coded by η (see Sect. 2.3). Galaxies in rich groups with more than ten members are shown as circles and field galaxies as black squares (both have the redshift cut 0.5 < z < 0.9 applied). The mass model rotation curve is used (see Fig. A.2 for the flat model rotation curve instead). As an indication, the best-fit linear relations (with redshift cut applied, see also Table 1) for the field and rich groups sub-samples are shown as grey and black plain lines, respectively. The typical uncertainty is shown as the black error-bar on the bottom right corner.
Current usage metrics show cumulative count of Article Views (full-text article views including HTML views, PDF and ePub downloads, according to the available data) and Abstracts Views on Vision4Press platform.
Data correspond to usage on the plateform after 2015. The current usage metrics is available 48-96 hours after online publication and is updated daily on week days.
Initial download of the metrics may take a while.