Fig. 4.
Download original image
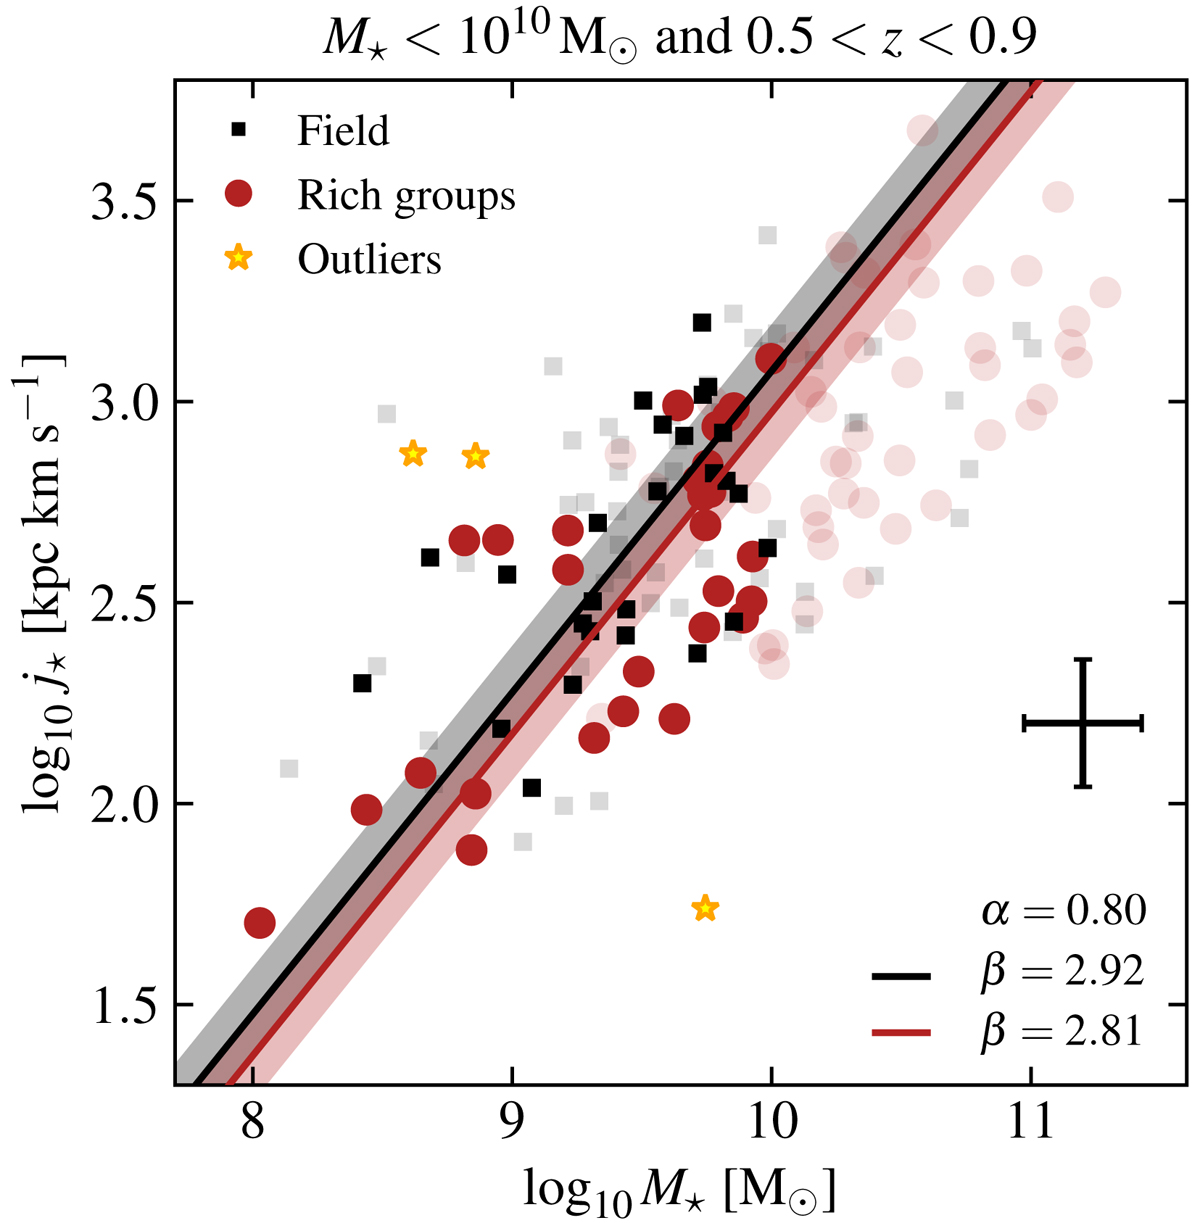
Fall relation for galaxies in the field (black squares) and those in rich groups with more than ten members (red circles). A stellar mass cut M⋆ < 1010 M⊙ and a redshift cut 0.5 < z < 0.9 were applied to each sub-sample. Outliers detected during the fitting process are identified with yellow stars and the typical uncertainty is shown with a black error-bar. The best-fit lines are shown for the field (black) and groups’ (red) sub-samples, along with their 95% confidence intervals (coloured areas) determined with jackknife resampling. Galaxies removed by the mass and redshift cuts are identified with semi-transparent symbols.
Current usage metrics show cumulative count of Article Views (full-text article views including HTML views, PDF and ePub downloads, according to the available data) and Abstracts Views on Vision4Press platform.
Data correspond to usage on the plateform after 2015. The current usage metrics is available 48-96 hours after online publication and is updated daily on week days.
Initial download of the metrics may take a while.