Fig. 3.
Download original image
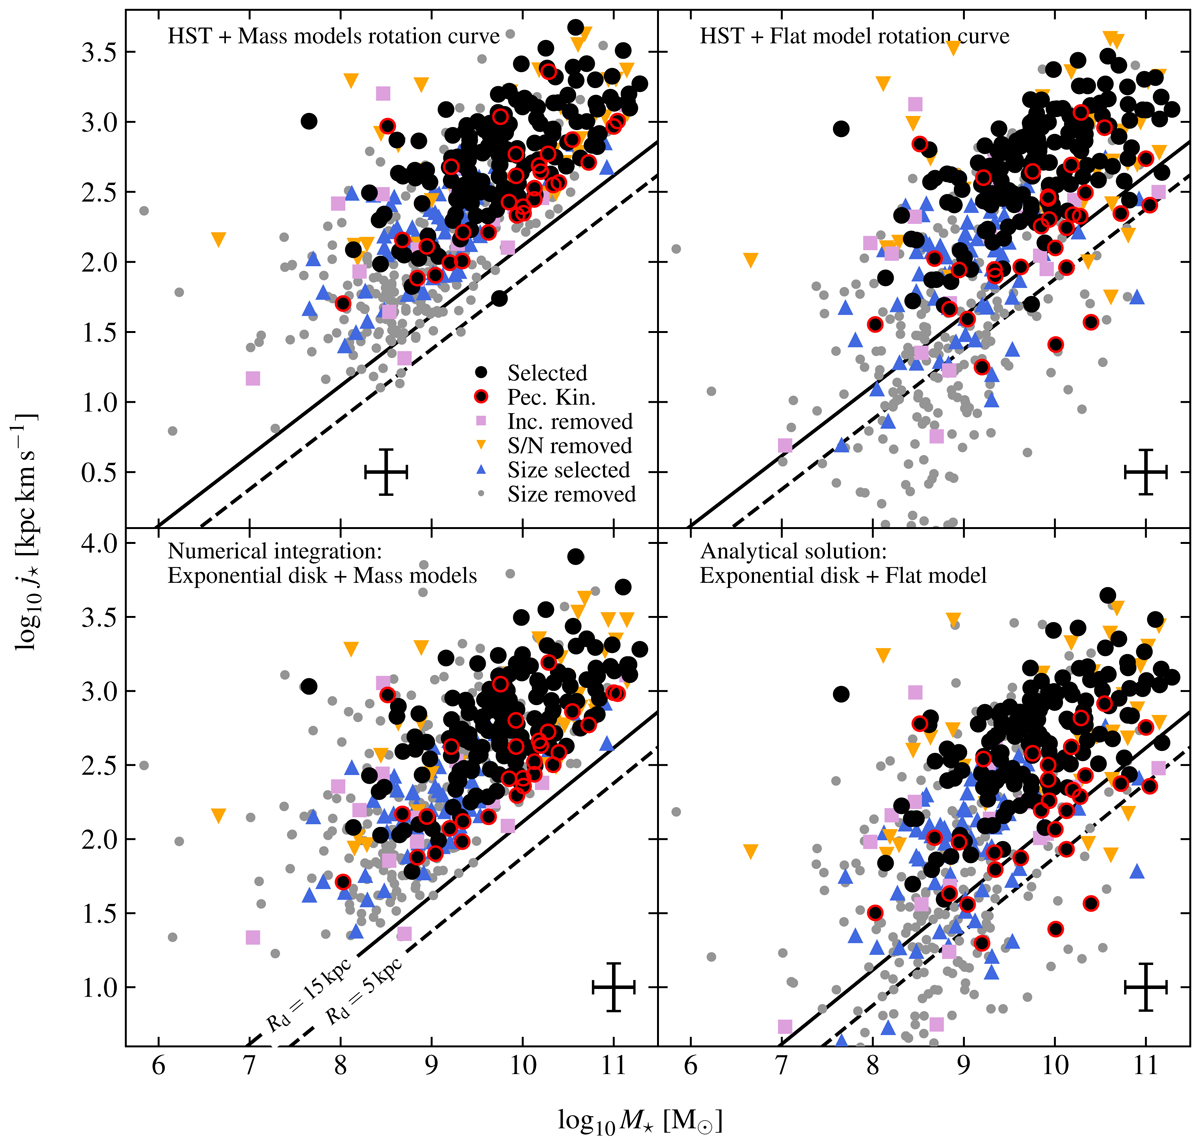
Fall relation for the kinematics sample using various formalisms. On the top row is shown the angular momentum derived using HST maps and on the bottom row that derived using an exponential disk model. The leftmost column represents the Fall relation when using the rotation curve derived from the mass modelling and the rightmost column the Fall relation when using a flat model rotation curve (the top-left plot is similar to Fig. 2). Galaxies selected for the analysis are shown as black points and those flagged with peculiar kinematics with red contours. Other symbols correspond to galaxies removed by the selection (see Fig. 1 for more details). The typical uncertainty is shown on the bottom of each plot as a black error-bar. The two black lines show the limit of the Fall relation for an exponential disk without DM halo and with two different disk scale lengths of 5 kpc (dashed line) and 15 kpc (plain line, see Eq. (D.18)).
Current usage metrics show cumulative count of Article Views (full-text article views including HTML views, PDF and ePub downloads, according to the available data) and Abstracts Views on Vision4Press platform.
Data correspond to usage on the plateform after 2015. The current usage metrics is available 48-96 hours after online publication and is updated daily on week days.
Initial download of the metrics may take a while.