Fig. 2.
Download original image
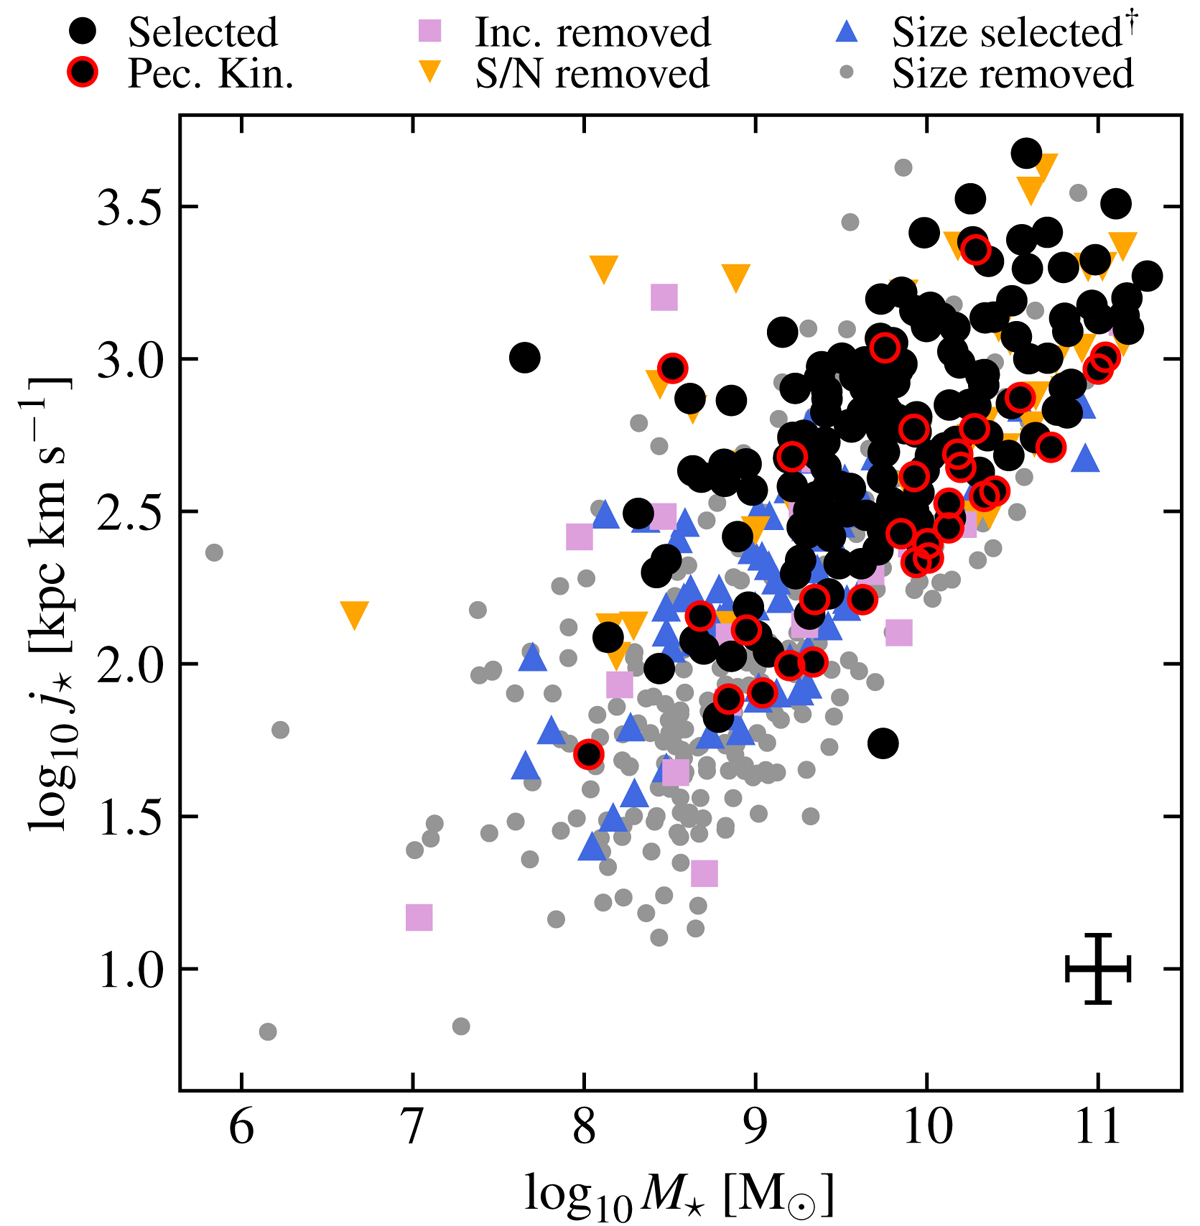
Fall relation for the entire kinematics sample, using bulge-removed HST images. Galaxies selected from the kinematics sample are represented with black points and other symbols represent galaxies removed by different selection criteria (see Fig. 1). Red contours correspond to galaxies flagged with peculiar kinematics. The typical uncertainty (including systematic uncertainties added when fitting the relation) is shown as an error bar on the bottom right corner. †Galaxies removed by the surface criterion defined in Sect. 2.4 but that would have been kept by the size selection criterion used in Mercier et al. (2022).
Current usage metrics show cumulative count of Article Views (full-text article views including HTML views, PDF and ePub downloads, according to the available data) and Abstracts Views on Vision4Press platform.
Data correspond to usage on the plateform after 2015. The current usage metrics is available 48-96 hours after online publication and is updated daily on week days.
Initial download of the metrics may take a while.