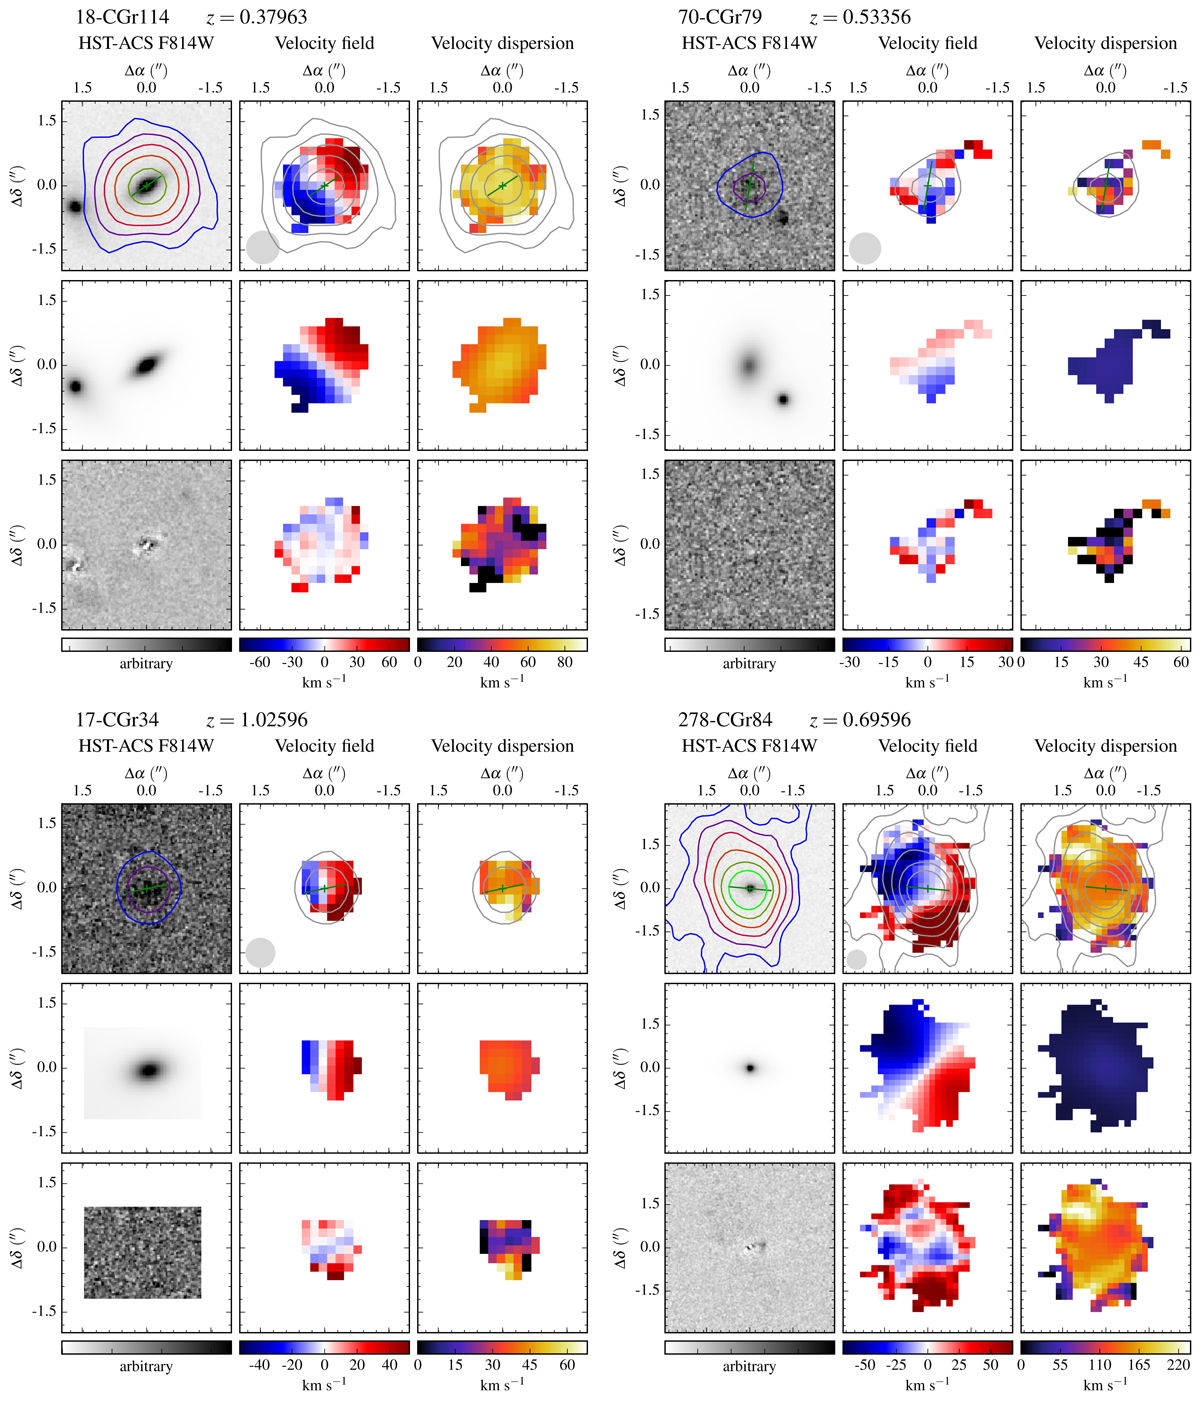
Fig. B.1.
Download original image
Examples of morpho-dynamical models obtained in Mercier et al. (2022) and used in this analysis. For each sub-figure and from top to bottom we have the HST image, the MUSE-HUDF model, and the residuals in the leftmost column, the velocity field map extracted with CAMEL, the best-fit MocKinG velocity field, and the residuals in the middle column, and the raw velocity dispersion map extracted with CAMEL, the beam-smearing model from MocKinG, and the beam-smearing corrected velocity dispersion map from MocKinG in the rightmost column. The top left sub-figure shows a galaxy with a seemingly correct dynamical model, the top right one shows a low S/N galaxy without any velocity gradient in its velocity field map that was flagged, the bottom left one shows a low S/N galaxy with a weak but non-negligible velocity gradient that was not flagged, and the bottom right one shows a massive galaxy with a kinematically disturbed velocity field that was flagged as well.
Current usage metrics show cumulative count of Article Views (full-text article views including HTML views, PDF and ePub downloads, according to the available data) and Abstracts Views on Vision4Press platform.
Data correspond to usage on the plateform after 2015. The current usage metrics is available 48-96 hours after online publication and is updated daily on week days.
Initial download of the metrics may take a while.