Open Access
Fig. A.5.
Download original image
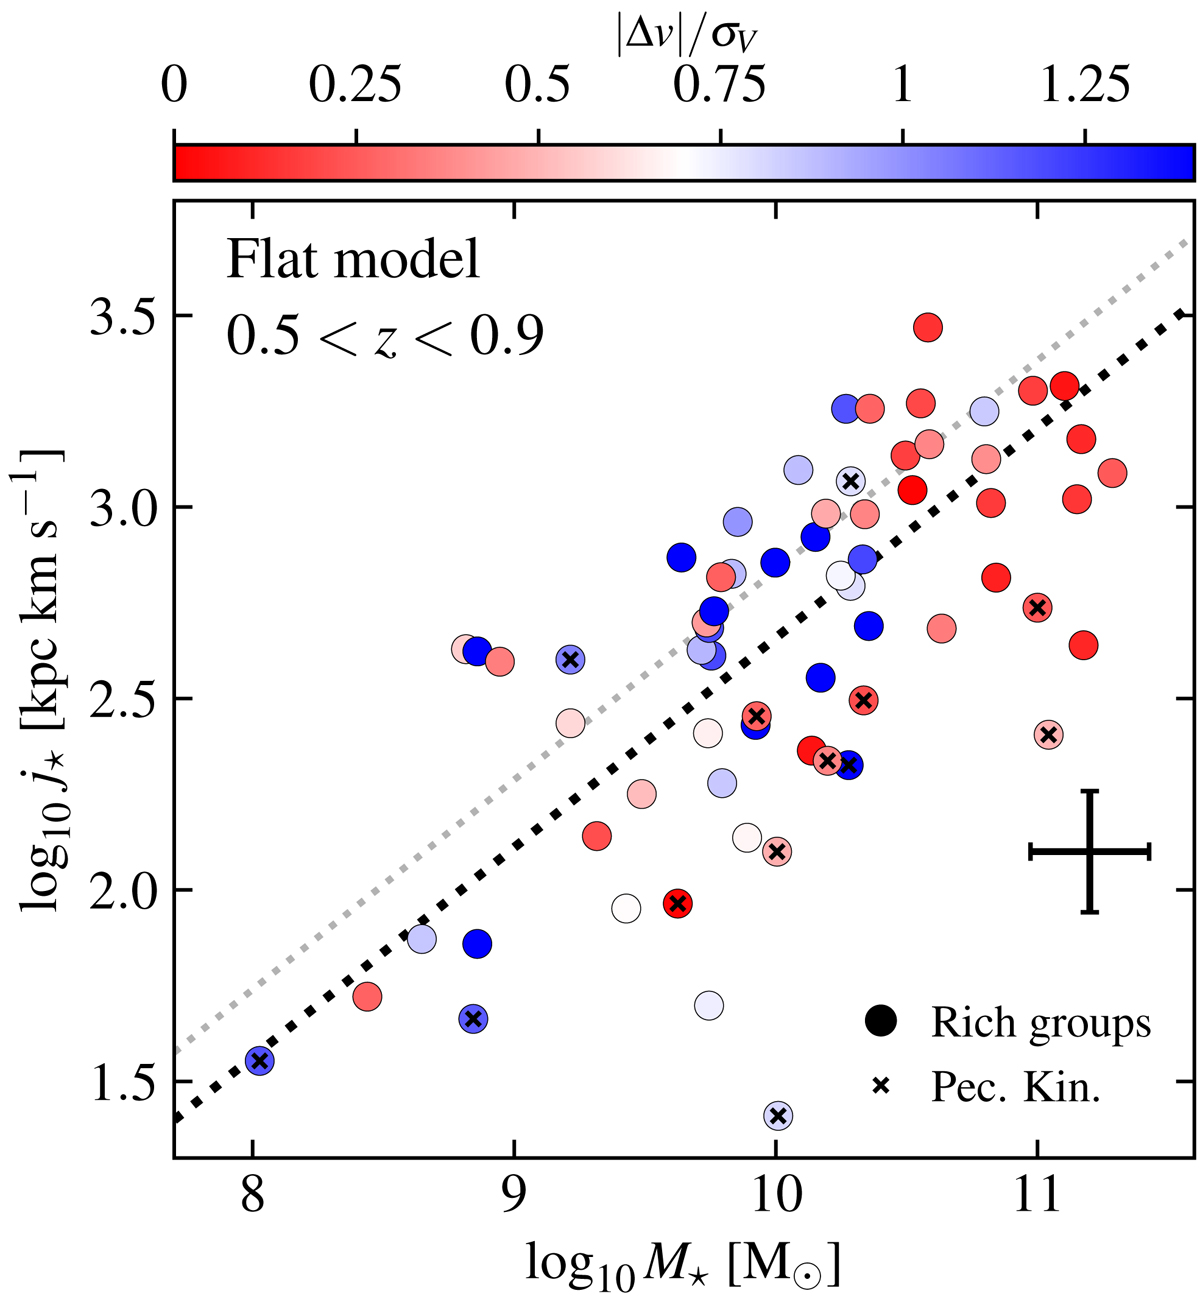
Fall relation colour coded according to the galaxies’ line-of-sight systemic velocity |Δv| normalised by the velocity dispersion of their host group σV. This figure is similar to Fig. 6 but uses a flat rotation curve model instead
Current usage metrics show cumulative count of Article Views (full-text article views including HTML views, PDF and ePub downloads, according to the available data) and Abstracts Views on Vision4Press platform.
Data correspond to usage on the plateform after 2015. The current usage metrics is available 48-96 hours after online publication and is updated daily on week days.
Initial download of the metrics may take a while.