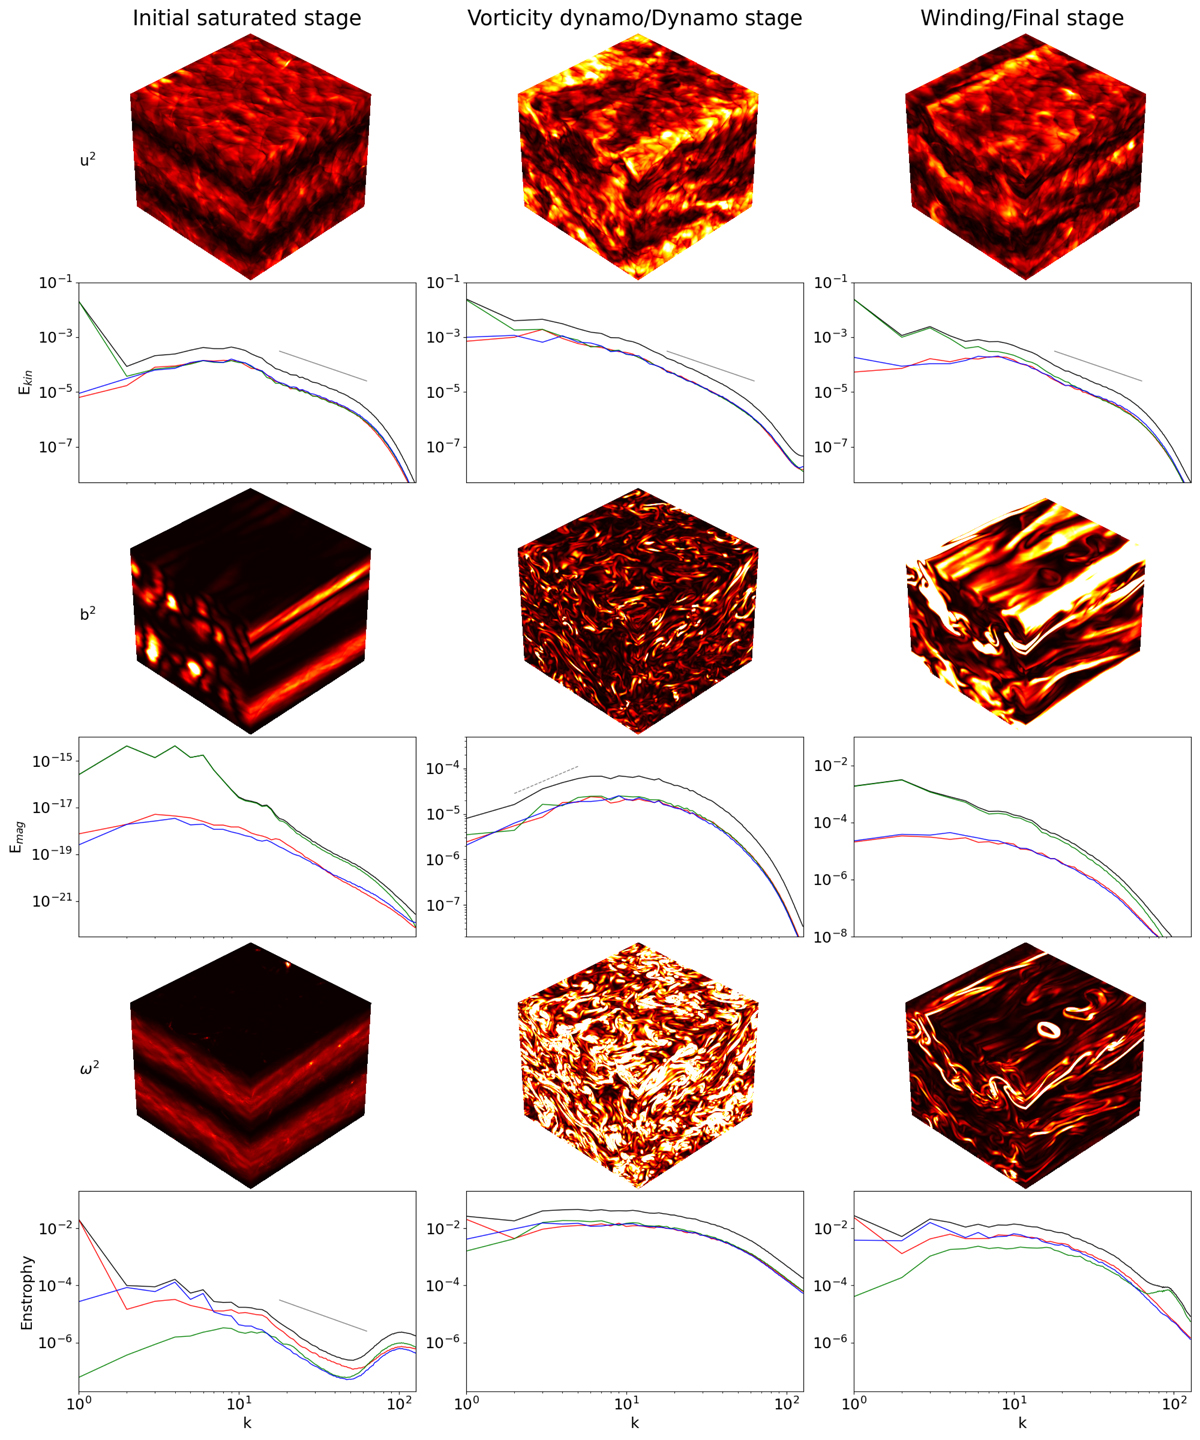
Fig. 8.
Download original image
Spectra and snapshots over three faces of the domain, for the squares of velocity, u2, magnetic field, b2, and vorticity, ω2, of the run M_0A020. We display three different phases of the evolution of the system, evolving over time from left to right. Color bars have different ranges to allow a better visualization: for u2 the range is (0,0.2); for b2 the range is (0,1e−13) for the first snapshot and (0,0.015) for the others; for ω2 the range is (0,0.2) for the first snapshot and (0, 2.0) for the others, all in code units. The x, y and z components of the spectra correspond to the red, green and blue lines, respectively. Slope lines in the kinetic energy spectra are proportional to k−2 before the dynamo and get a bit steeper afterwards. Magnetic energy spectra take a typical Kazantsev k3/2 slope during the kinematic phase of the dynamo (Kazantsev 1968). We note that the scale of the kinetic energy and vorticity spectra (or enstrophy spectra) are kept constant, but the magnetic ones are not, in order to follow the magnetic field growth.
Current usage metrics show cumulative count of Article Views (full-text article views including HTML views, PDF and ePub downloads, according to the available data) and Abstracts Views on Vision4Press platform.
Data correspond to usage on the plateform after 2015. The current usage metrics is available 48-96 hours after online publication and is updated daily on week days.
Initial download of the metrics may take a while.