Open Access
Fig. 5.
Download original image
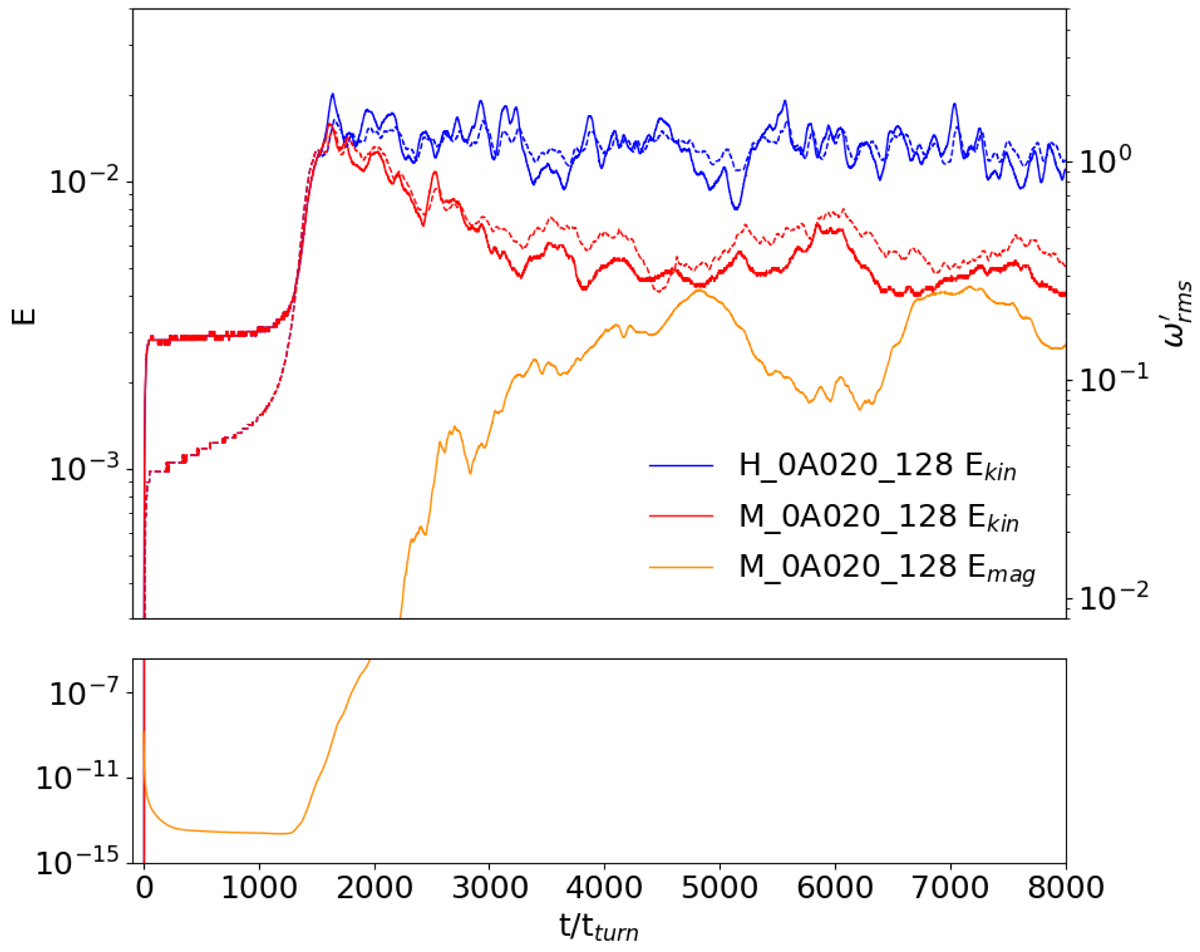
Time evolution for the average turbulent kinetic energy density (solid blue and red lines), the average magnetic energy density (yellow line) and the root mean square of the turbulent vorticity ![]() (dashed blue and red lines) for one HD setup and for an MHD set up with the same physical parameters, M_0A020_128.
(dashed blue and red lines) for one HD setup and for an MHD set up with the same physical parameters, M_0A020_128.
Current usage metrics show cumulative count of Article Views (full-text article views including HTML views, PDF and ePub downloads, according to the available data) and Abstracts Views on Vision4Press platform.
Data correspond to usage on the plateform after 2015. The current usage metrics is available 48-96 hours after online publication and is updated daily on week days.
Initial download of the metrics may take a while.