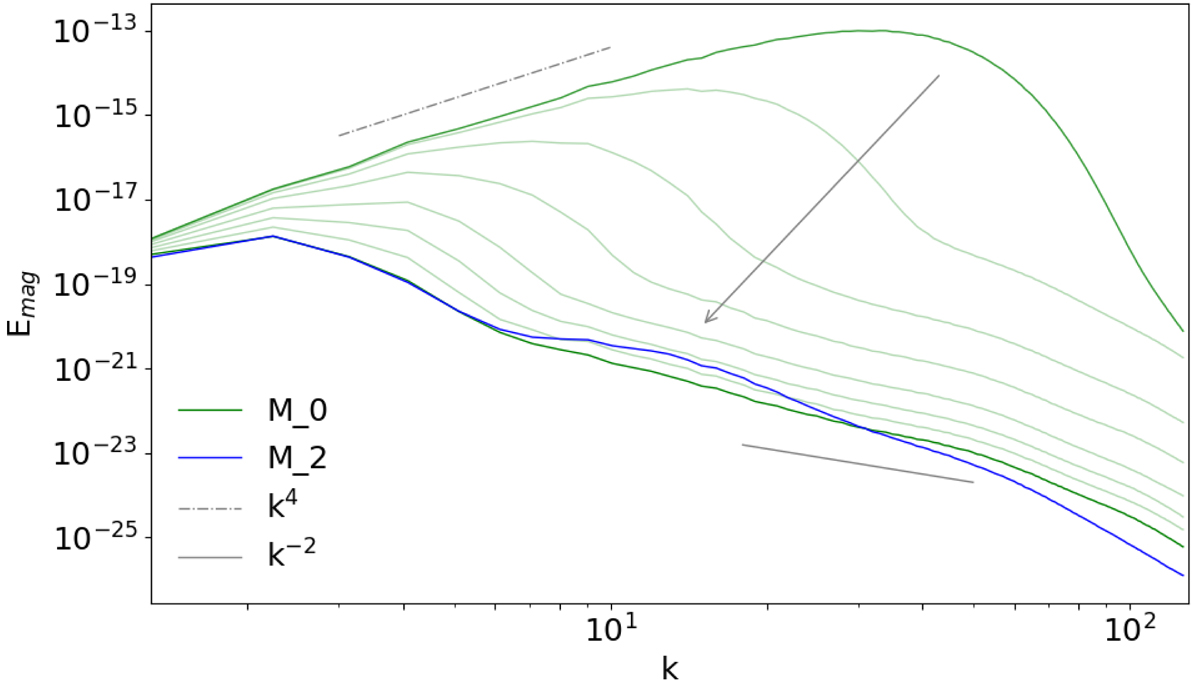
Fig. 4.
Download original image
Magnetic spectra decay for the M_0 and M_2 models. The spectra evolution is only shown for M_0, and the first corresponds to less than a turnover time when it still shows the initial slope of k4. The arrow indicates the direction of temporal evolution. The last spectrum is approximately at turnover time 20 and it is shown for both models.
Current usage metrics show cumulative count of Article Views (full-text article views including HTML views, PDF and ePub downloads, according to the available data) and Abstracts Views on Vision4Press platform.
Data correspond to usage on the plateform after 2015. The current usage metrics is available 48-96 hours after online publication and is updated daily on week days.
Initial download of the metrics may take a while.